

Exponential Functions
Write and interpret exponential functions modeling growth and decay, f(x) = a·bˣ.
Students interpret exponential growth and decay models by identifying the initial value and constant multiplier, contrasting repeated multiplication with linear change.
Lesson plan and worked examples by TEKSForge · not a TEA-issued lesson. Videos by independent educators.
Learn the concept
Constant multiplier
An exponential model has initial value a at t=0 and a constant multiplicative factor b per period. Growth uses b>1; decay uses 0<b<1. Equal time steps multiply by the same factor rather than add the same amount.
Percent and model
For growth rate r, use . For decay rate r, use , with r expressed as a decimal. A factor of 0.8 means retaining 80% and losing 20% each period. Make the exponent's unit agree with the stated rate period.
Check with a table
Evaluate consecutive periods and compare ratios. In a context, interpret the initial value, multiplier, and output units. Exponential percentage change acts on the current amount, not repeatedly on the original amount.
Visualize the concept
Original TEKSForge instructional diagrams, designed for this TEKS skill and clearly distinguished from released STAAR artwork.

Study released STAAR visuals
Use the original graphs, tables, and diagrams from released STAAR questions to practice reading labels, values, and relationships before answering the items below.
Released STAAR Algebra I EOC · 2022 · Item 26 · 1 point
Released STAAR Algebra I EOC · 2019 · Item 31 · 1 point
Released STAAR Algebra I EOC · 2019 · Item 9 · 1 point
Released STAAR Algebra I EOC · 2022 · Item 9 · 1 point
Released STAAR Algebra I EOC · 2021 · Item 11 · 1 point
Released STAAR Algebra I EOC · 2021 · Item 38 · 1 point
Released STAAR Algebra I EOC · 2026 · Item 15 · 1 point
Worked example
A device costs $800 and loses 15% of its value each year. Write a model and find its value after two years.
- Initial value is 800 and retained fraction is 1−0.15=0.85.
- Write , with t in years.
- Evaluate .
After two years, the modeled value is $578.
Watch the lesson
Texas public-school, Texas educator-created, and TEKS-aligned lessons, hosted by their creators. Each card names its source.
Algebra 1 Writing Exponential Functions from Real-world Situations
Five Minute Math · Aaron Daffern, Dallas ISDTranslate real-world growth and decay into an initial value and constant multiplier.
Watch on YouTubeTry it yourself
TEKSForge practice · unscored
1. A population starts at 600 and grows 5% annually. Write its model.
Show answer and reasoning
Convert 5% to 0.05 and add it to 1. The base is 1.05, not 0.05.
2. In , what is the decay rate?
Show answer and reasoning
28% per period
The model retains 72%. Subtract 0.72 from 1 to get 0.28, or 28% lost.
Released STAAR practice
Texas Education Agency · released EOC items · explanations adapted from TEA rationales. Original graphs, tables, and diagrams are shown where the released item includes one.
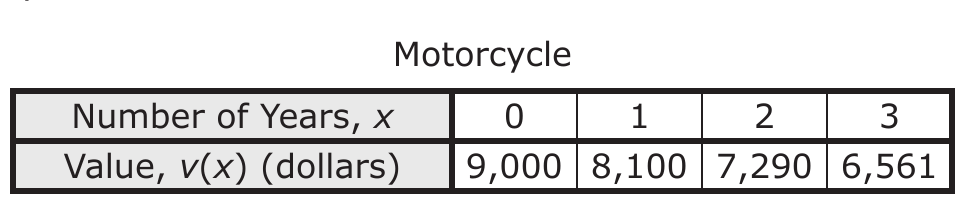
Released STAAR Algebra I EOC · 2022 · Item 26 · 1 point
The table shows the value in dollars of a motorcycle at the end of years. Which exponential function models this situation?
Show STAAR answer and explanation
The starting value (at ) is 9,000. Each value divided by the one before gives , so .
: The division was flipped. Divide each value by the previous one: 0.9, a decay factor.
: The starting value is at , not , and the factor is 0.9.
: The factor is right, but the starting value is the value at : 9,000.
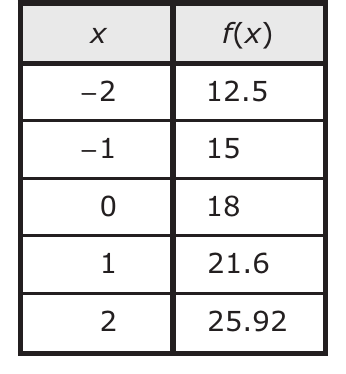
Released STAAR Algebra I EOC · 2019 · Item 31 · 1 point
The table represents some points on the graph of an exponential function. Which function represents the same relationship?
Show STAAR answer and explanation
The initial value is . Divide each value by the one before: , and so on. So .
: The initial value is , not , and the division was flipped.
: The factor is right, but the initial value is .
: The values increase, so the factor must be greater than 1: .
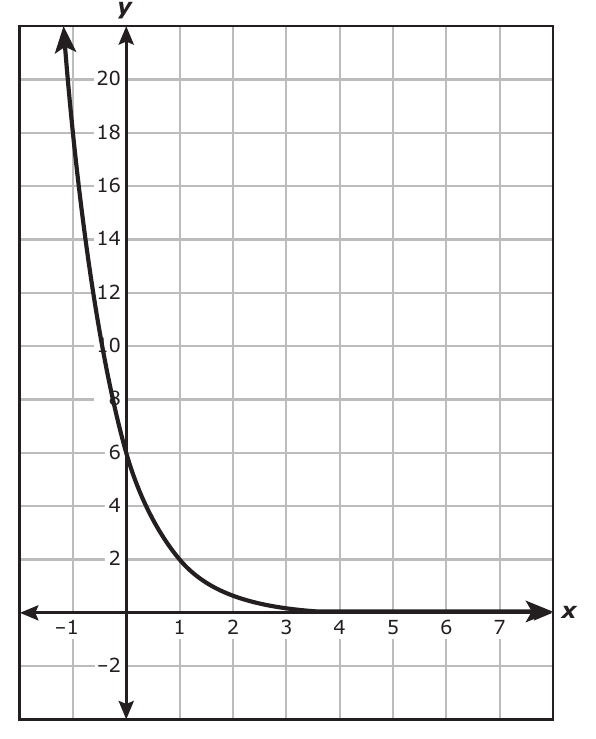
Released STAAR Algebra I EOC · 2019 · Item 9 · 1 point
An exponential function is graphed on the grid. Which function is best represented by the graph?
Show STAAR answer and explanation
The y-intercept is 6, so . Each y-value is of the one before (, ), so .
: The y-values were divided in the wrong order. Divide each value by the previous one: .
: An exponential function multiplies: , not .
: An exponential function has the form , and the factor here is .
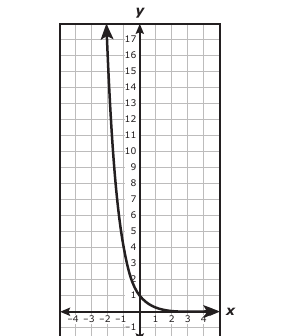
Released STAAR Algebra I EOC · 2022 · Item 9 · 1 point
An exponential function is graphed on the grid. Which function is best represented by the graph?
Show STAAR answer and explanation
The y-intercept is 1, so . The next values are multiplied by 0.25, giving .
: This has y-intercept 2 and common factor 0.5; the graph has y-intercept 1 and factor 0.25.
: A base greater than 1 models growth, while this graph decays.
: A base of 25 produces rapid growth, not the decay shown.
Released STAAR Algebra I EOC · 2021 · Item 11 · 1 point
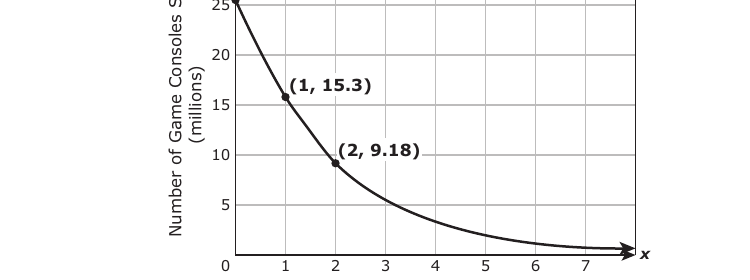
The graph shows the number of game consoles sold in millions since 2009. Based on this information, which function best models the number of game consoles sold in millions years since 2009?
Show STAAR answer and explanation
At , sales are 25.5 million, so . The ratio gives the decay factor.
: The initial value and decay factor are reversed.
: The initial value is 25.5 at , and the values decrease rather than grow.
: The initial value is right, but the common factor is .
Released STAAR Algebra I EOC · 2021 · Item 38 · 1 point
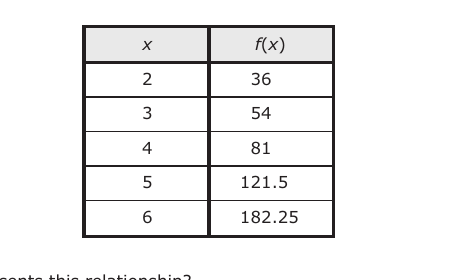
The table represents some points on the graph of an exponential function. Which function represents this relationship?
Show STAAR answer and explanation
Each value is multiplied by . Since , , so .
: The table increases, so the base must be greater than 1.
: 36 is , not the initial value .
: The initial value is 16 and the values grow by factor .
Released STAAR Algebra I EOC · 2025 · Item 18 · 1 point
The table represents some points on the graph of an exponential function. Which function represents the relation shown in the table?
| $x$ | $P(x)$ |
|---|---|
| −1 | 270 |
| 0 | 90 |
| 1 | 30 |
| 2 | 10 |
Show STAAR answer and explanation
In , is the value when , so . Each value divided by the previous value is , so .
: The value of was taken from instead of .
: Each value was divided by the next value instead of the previous value, giving .
: The value of was taken from , and the common factor was found by dividing each value by the next one.
Released STAAR Algebra I EOC · 2025 · Item 47 · 1 point
A bank customer opened a money market account with $2,500. Each year the bank will add interest to the account, which will increase the account’s value by 0.5%. Which function can be used to determine the amount, , in the account after years?
Show STAAR answer and explanation
Use . The initial value is . A 0.5% increase each year gives a growth factor of , so .
: The growth rate, 0.5%, was used as the growth factor without converting the percent.
: This linear function adds a constant amount; interest that grows by a percent is exponential.
: The growth factor was multiplied by instead of raised to the power .
Released STAAR Algebra I EOC · 2026 · Item 15 · 1 point
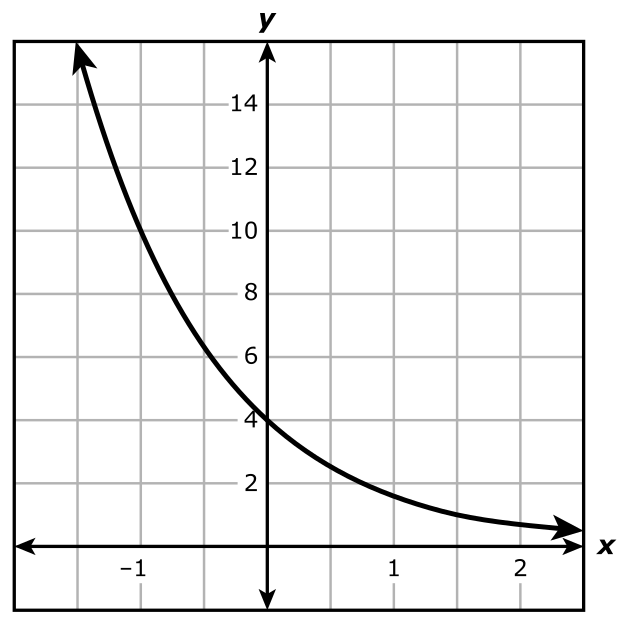
The graph of the exponential function shown on the grid passes through the points and . Which function is represented by the graph?
Show STAAR answer and explanation
The -intercept is , so . Dividing consecutive values gives , so .
: This assumes the graph passes through , giving .
: The values of and were transposed.
: This assumes the graph passes through and transposes and .
Released STAAR Algebra I EOC · 2026 · Item 34 · 1 point
The table shows some points on the graph of an exponential function. Which function represents the relation shown in the table?
| $x$ | $f(x)$ |
|---|---|
| −2 | 64 |
| −1 | 16 |
| 0 | 4 |
| 1 | 1 |
Show STAAR answer and explanation
Each value divided by the previous value is , so . The value when is 4, so and .
: The values of and were reversed.
: The value of was taken from instead of .
: Each value was divided by the next value, giving , and was taken from .
Learning objectives
By the end of the lesson, students can:
- Interpret a and b in .
- Distinguish growth from decay and convert between decimal multipliers and percent change.
- Evaluate and write exponential models for contextual data.
Instructional sequence
- 1
Engage
5 minCompare adding 500 people each year with increasing by 10% each year and ask why the patterns diverge.
- 2
Direct instruction
12 minIdentify a as the value at x=0 and b as the repeated factor. Connect b>1 to growth and 0<b<1 to decay.
- 3
Guided practice
13 minBuild a table for and interpret as retaining 85% and losing 15%.
- 4
Model writing
13 minStudents write models from an initial amount and percent rate, then evaluate for a specified time using repeated multiplication or a calculator.
- 5
Closure
7 minComplete the exit ticket and label initial value, multiplier, and percent change.
Misconceptions to address
Teacher move: The model retains 85%; the decay rate is , or 15%.
Teacher move: The same percentage acts on a changing current amount, so the absolute increase grows.