

Rational Function Graphs
Determine where rational-function values satisfy an inequality.
Students solve rational inequalities from graphs and tables by locating zeros and vertical asymptotes, testing each interval, and describing where or .
Lesson plan and worked examples by TEKSForge · not a TEA-issued lesson. Videos by independent educators.
Archived course: TEKS code and readiness label from TEA's 2013 Algebra II key. Algebra II is not one of Texas's current required STAAR EOC assessments, and this lesson does not change the Biology and Algebra I Study Plans.
Learn the concept
Read the inequality from the graph
means the output is positive, so the graph lies above the x-axis. means the graph is below the x-axis. The answer is a set of x-values.
Find boundary points
A rational function can change sign at a zero, where its numerator is 0, or at a vertical asymptote, where its denominator is 0. For , the boundary points are and .
Test and exclude
Choose a test value in each interval to find the sign. For strict inequalities, exclude zeros. Always exclude vertical asymptote values because the function is undefined there.
Study released STAAR visuals
Use the original graphs, tables, and diagrams from released STAAR questions to practice reading labels, values, and relationships before answering the items below.
Archived released STAAR Algebra II EOC · 2013 · Item 8 · 1 point
Worked example
For , find where .
- Boundary points: the zero is and the asymptote is .
- Test : .
- Test : .
- Test : .
or
Watch the lesson
Texas public-school, Texas educator-created, and TEKS-aligned lessons, hosted by their creators. Each card names its source.
Algebra 2 Quadratic Inequalities
UT IPSI · Kid2Kid / Texas Education AgencyUse graphs and intervals to decide where a function is above or below the x-axis.
Watch on YouTubeAlgebra 2 Identifying Parent Functions
UT IPSI · Kid2Kid / Texas Education AgencyRecognize parent-function graphs, including rational functions, by their key features.
Watch on YouTubeTry it yourself
TEKSForge practice · unscored
1. A graph of g has a vertical asymptote at x = 3. It is below the x-axis for x < 3 and above it for x > 3. Solve g(x) > 0.
Show answer and reasoning
The graph is above the x-axis only to the right of the asymptote. The value 3 is excluded because g is undefined there.
2. For , solve .
Show answer and reasoning
One divided by a negative number is negative. The function is undefined at 0 and positive for every positive x.
Released STAAR practice
Texas Education Agency · archived 2013 released EOC items · scored with TEA's answer key; step-by-step explanations written by TEKSForge because this release has no rationales. Original graphs, tables, and diagrams are shown where the released item includes one.
Archived released STAAR Algebra II EOC · 2013 · Item 8 · 1 point
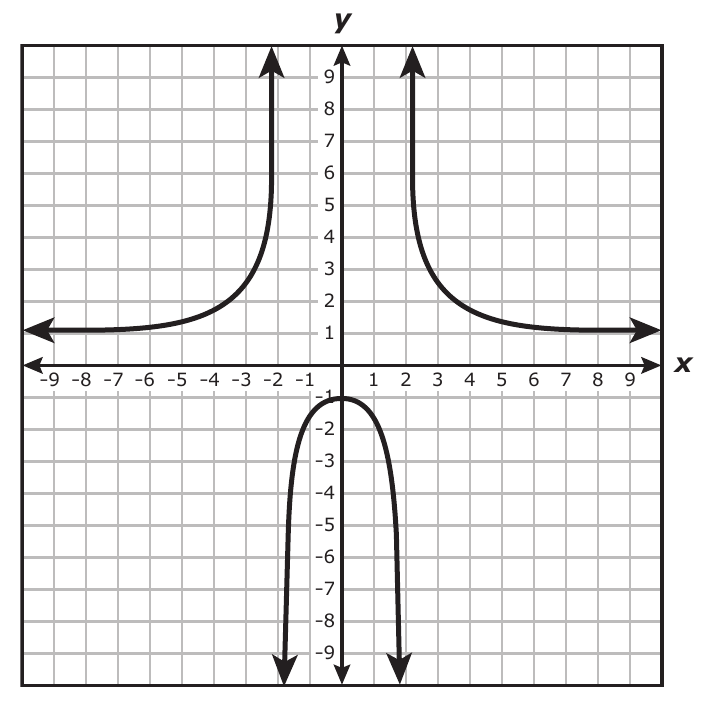
The graph of the function is shown on the grid. Based on the graph, for what values of is ?
- All real numbers greater than 0
- All real numbers greater than 1
- All real numbers less than −2 or greater than 2
- All real numbers greater than −2 and less than 2
Show STAAR answer and explanation
All real numbers less than −2 or greater than 2
Positive function values lie above the x-axis. The left upper branch has , and the right upper branch has .
All real numbers greater than 0: This includes values between 0 and 2, where the middle branch is below the x-axis, and omits the positive left branch.
All real numbers greater than 1: This includes , where the graph is negative, and omits the positive left branch.
All real numbers greater than −2 and less than 2: The middle branch is below the x-axis on this interval, so these values give .
Learning objectives
By the end of the lesson, students can:
- Interpret as the part of a graph above the x-axis.
- Use zeros and vertical asymptotes to divide the x-axis into intervals.
- Write solution sets with inequalities, excluding values where f is undefined or equal to zero.
Instructional sequence
- 1
Engage
5 minShade the parts of a rational graph that lie above the x-axis. Ask what x-values those pieces use.
- 2
Direct instruction
12 minModel finding zeros and vertical asymptotes, then marking them as boundary points on a number line.
- 3
Sign chart practice
13 minTest one value in each interval and record whether the output is positive or negative.
- 4
Graph and algebra
13 minMatch sign-chart results to the graph and write each answer with inequality notation.
- 5
Closure
7 minStudents explain why an asymptote value is never included, then complete the exit ticket.
Misconceptions to address
Teacher move: The inequality describes the output. Look for where the graph is above the x-axis, which can include negative x-values.
Teacher move: The function is undefined there, so the value is excluded even if the graph is positive on both sides.