

Exponential Inequalities
Solve exponential inequalities using graphs and tables.
Students solve exponential inequalities with graphs and tables by locating a threshold crossing, checking whether the function increases or decreases, and deciding whether to include the boundary.
Lesson plan and worked examples by TEKSForge · not a TEA-issued lesson. Videos by independent educators.
Archived course: TEKS code and readiness label from TEA's 2013 Algebra II key. Algebra II is not one of Texas's current required STAAR EOC assessments, and this lesson does not change the Biology and Algebra I Study Plans.
Learn the concept
Locate the threshold
To solve , draw and find its intersection with the exponential curve. A table can identify the exact crossing when it includes an output equal to k.
Choose the correct side
For an increasing exponential, outputs exceed the threshold to the right of the crossing. For a decreasing exponential, they exceed it to the left. Confirm with a test input rather than memorizing a direction.
Include or exclude the boundary
Strict inequalities exclude equality. The symbols and include the crossing. If the variable counts completed days or other whole-number periods, intersect the interval with the allowed contextual inputs.
Study released STAAR visuals
Use the original graphs, tables, and diagrams from released STAAR questions to practice reading labels, values, and relationships before answering the items below.
Archived released STAAR Algebra II EOC · 2013 · Item 30 · 1 point
Worked example
Use a table and graph reasoning to solve for .
- Compute nearby outputs: , , and .
- The curve intersects the target line at .
- The base 2 makes the function increasing, so it stays above the target to the right.
- The inequality is strict, so exclude the crossing input.
Watch the lesson
Texas public-school, Texas educator-created, and TEKS-aligned lessons, hosted by their creators. Each card names its source.
Algebra 2 Solving Exponential Equations
UT IPSI · Kid2Kid / Texas Education AgencyLocate exponential threshold crossings before interpreting inequality solution intervals.
Watch on YouTubeTry it yourself
TEKSForge practice · unscored
1. Solve .
Show answer and reasoning
The increasing function equals 90 at . Outputs at or below 90 occur at or left of that input.
2. A quantity is , where d counts completed days beginning at 0. On which days is ?
Show answer and reasoning
Whole-number days .
, and the function decreases. The continuous solution is ; completed days begin at 4.
Released STAAR practice
Texas Education Agency · archived 2013 released EOC items · scored with TEA's answer key; step-by-step explanations written by TEKSForge because this release has no rationales. Original graphs, tables, and diagrams are shown where the released item includes one.
Archived released STAAR Algebra II EOC · 2013 · Item 30 · 1 point
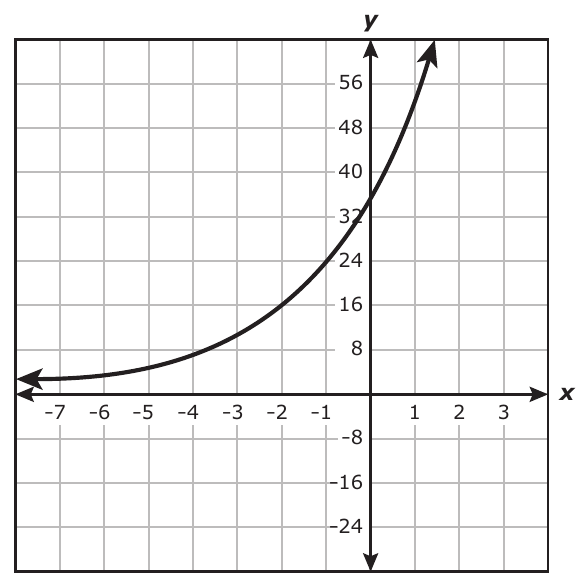
The graph of the exponential function is shown on the grid. For what values of is ?
Show STAAR answer and explanation
The increasing curve passes through . Because f increases everywhere, its values are greater than 16 for every x to the right of −2.
: At , is about 32; the values are already above 16 for .
: The curve keeps rising after , so there is no upper bound on x.
: To the left of , the values are less than 16.
Learning objectives
By the end of the lesson, students can:
- Interpret an exponential inequality as a comparison with a horizontal line.
- Use monotonic behavior to choose the correct side of a threshold.
- Write continuous and whole-number contextual solution sets.
Instructional sequence
- 1
Engage
5 minDraw a horizontal target line and ask where an increasing curve exceeds it.
- 2
Direct instruction
10 minLocate the crossing and compare the graph with the target line on each side.
- 3
Guided practice
12 minUse tables to confirm solutions for growth and decay functions.
- 4
Context connection
12 minTranslate continuous intervals into allowed whole-number times when needed.
- 5
Closure
6 minStudents explain the direction and endpoint in the exit ticket.
Misconceptions to address
Teacher move: The inequality compares outputs with 20. Find the inputs whose graph heights exceed that target.
Teacher move: That works for greater-than comparisons on increasing graphs. Check direction again for decreasing graphs.