

Parent Functions
Identify and sketch graphs of parent functions, including exponential functions.
Students identify an exponential parent function by removing transformations and checking its intercept, direction, and horizontal asymptote.
Lesson plan and worked examples by TEKSForge · not a TEA-issued lesson. Videos by independent educators.
Archived course: TEKS code and readiness label from TEA's 2013 Algebra II key. Algebra II is not one of Texas's current required STAAR EOC assessments, and this lesson does not change the Biology and Algebra I Study Plans.
Learn the concept
Remove transformations
Within a fixed-base exponential family, the parent of is . Remove shifts and the outside multiplier, not the given base.
Build defining points
For , the points , , and lie on the parent. Outputs are positive and increase from left to right.
Use end behavior
For , approaches zero as x decreases without bound. Its horizontal asymptote is , domain is all real numbers, and range is . A downward shift changes the asymptote; reflection across the y-axis reverses the direction.
Worked example
Identify and sketch the parent for .
- Remove the horizontal and vertical shifts to obtain .
- Plot , , and .
- Draw an increasing curve above the x-axis that approaches on the left.
The parent is , increasing through with asymptote .
Watch the lesson
Texas public-school, Texas educator-created, and TEKS-aligned lessons, hosted by their creators. Each card names its source.
Algebra 2 Identifying Parent Functions
UT IPSI · Kid2Kid / Texas Education AgencyRecognize exponential parent graphs by their shape, intercept, and asymptote.
Watch on YouTubeTry it yourself
TEKSForge practice · unscored
1. What is the parent of ?
Show answer and reasoning
Remove the multiplier 3, the right shift 1, and the upward shift 5.
2. Which describes : increasing through with asymptote , or increasing through with asymptote ?
Show answer and reasoning
The first description.
and positive powers approach zero for very negative inputs; the second description is shifted down.
Released STAAR practice
Texas Education Agency · archived 2013 released EOC items · scored with TEA's answer key; step-by-step explanations written by TEKSForge because this release has no rationales. Original graphs, tables, and diagrams are shown where the released item includes one.
Archived released STAAR Algebra II EOC · 2013 · Item 6 · 1 point
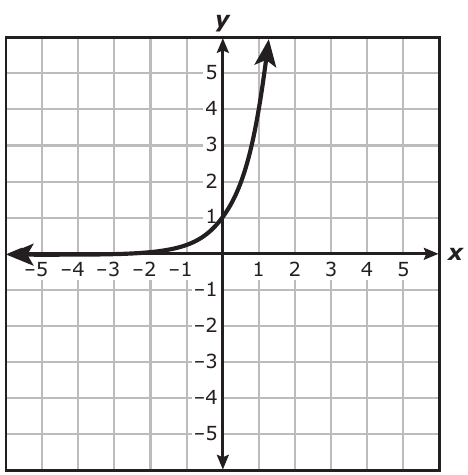
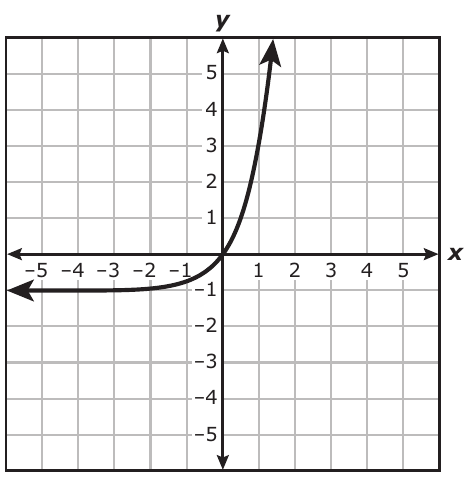
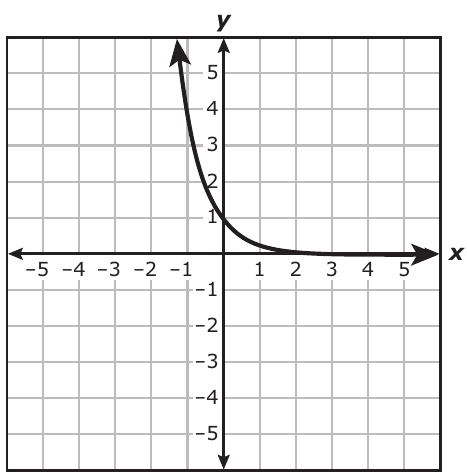
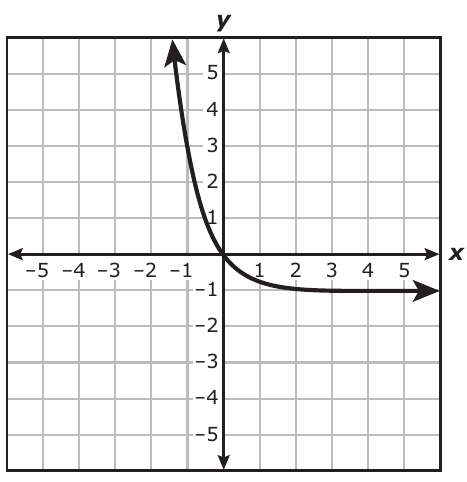
Which graph best represents the parent function of ?
- Graph F
- Graph G
- Graph H
- Graph J
Show STAAR answer and explanation
Graph F
The parent function of is . It passes through , increases from left to right, and approaches the x-axis () as x decreases. Graph F shows exactly those features.
Graph G: Graph G passes through the origin and levels off at , so it is the parent function shifted down 1 unit.
Graph H: Graph H decreases from left to right through ; it shows , the reflection of the parent across the y-axis.
Graph J: Graph J decreases and passes through the origin, so it is reflected and shifted down rather than the parent function.
Learning objectives
By the end of the lesson, students can:
- Identify an exponential parent rule from a transformed expression.
- Sketch key points of an increasing exponential parent.
- Distinguish parents from shifted or reflected graphs.
Instructional sequence
- 1
Engage
5 minSort familiar parent-function shapes.
- 2
Direct instruction
10 minRemove transformations while retaining the exponential base.
- 3
Guided practice
13 minBuild tables and sketch an exponential parent.
- 4
Compare and verify
15 minReject distractor graphs using intercepts, direction, and asymptotes.
- 5
Closure
7 minJustify the selected parent on the exit ticket.
Misconceptions to address
Teacher move: An exponential parent has , so its y-intercept is 1.
Teacher move: That constant translates the graph; the unshifted parent uses exponent x.