

Representations of Quadratics
Relate algebraic, tabular, graphical, and verbal representations of quadratic functions.
Students connect quadratic equations, tables, graphs, and verbal descriptions by identifying the vertex, symmetry, intercepts, and changing rate of growth.
Lesson plan and worked examples by TEKSForge · not a TEA-issued lesson. Videos by independent educators.
Archived course: TEKS code and readiness label from TEA's 2013 Algebra II key. Algebra II is not one of Texas's current required STAAR EOC assessments, and this lesson does not change the Biology and Algebra I Study Plans.
Learn the concept
Build a rule from the vertex
A vertex gives . Substitute another point to determine a. The vertex alone does not determine the width or direction of opening.
Read symmetry in a table
Distinct inputs with equal outputs lie equally far from the axis. If , the axis is . Reflect points with , preserving the output.
Connect shape to context
An area model such as has vertex at the origin and opens upward. In the physical domain , it rises more steeply as s increases. Tables at equally spaced inputs have constant second differences.
Study released STAAR visuals
Use the original graphs, tables, and diagrams from released STAAR questions to practice reading labels, values, and relationships before answering the items below.
Archived released STAAR Algebra II EOC · 2013 · Item 33 · 1 point
Worked example
A parabola has vertex (−2, 3) and passes through (0, 11). Write its rule and describe a table pattern that confirms its symmetry.
- Use the vertex: .
- Substitute : , so .
- The rule is .
- Inputs equally far from match: and .
, with axis and matching outputs at reflected inputs.
Watch the lesson
Texas public-school, Texas educator-created, and TEKS-aligned lessons, hosted by their creators. Each card names its source.
Algebra 2 Interpreting Quadratic Graphs
UT IPSI · Kid2Kid / Texas Education AgencyConnect vertices, symmetry, intercepts, and quadratic representations.
Watch on YouTubeTry it yourself
TEKSForge practice · unscored
1. A quadratic table includes , , , , and . Identify its vertex and y-intercept.
Show answer and reasoning
Vertex ; y-intercept .
Matching outputs show symmetry about x = 4. The table includes the vertex on that axis and the point whose input is 0.
2. Describe the graph of for .
Show answer and reasoning
It begins at the origin and rises more steeply as r increases.
The positive coefficient gives an upward-opening parabola. The physical restriction keeps only the nonnegative-input portion.
Released STAAR practice
Texas Education Agency · archived 2013 released EOC items · scored with TEA's answer key; step-by-step explanations written by TEKSForge because this release has no rationales. Original graphs, tables, and diagrams are shown where the released item includes one.
Archived released STAAR Algebra II EOC · 2013 · Item 12 · 1 point
Which function's graph has a vertex at and contains the point ?
Show STAAR answer and explanation
A vertex of gives . Substitute : , so and .
: This has vertex ; both coordinates of the vertex have the wrong sign.
: This has vertex , and at it gives , not 13.
: This has vertex ; shifts the graph left, not right.
Archived released STAAR Algebra II EOC · 2013 · Item 22 · 1 point
A table of values for the quadratic function is shown. Which of the following statements about the graph of are true? I. The graph has a line of symmetry at . II. The graph has a -intercept at . III. The graph has an -intercept at . IV. The graph has a vertex at .
| x | g(x) |
|---|---|
| −1 | −55 |
| 2 | −16 |
| 5 | 5 |
| 6 | 8 |
| 9 | 5 |
| 10 | 0 |
| 12 | −16 |
| 14 | −40 |
- I and II only
- III and IV only
- I, II, and III only
- I, II, III, and IV
Show STAAR answer and explanation
I, II, and III only
Equal outputs pair up around : and , so I is true. Reflecting across gives , so II is true. Reflecting the zero at gives a zero at , so III is true. The vertex must lie on , so IV is false.
I and II only: Statement III is also true: the zero at reflects across to .
III and IV only: Statement IV is false because the vertex lies on the axis ; is just a point in the table. Statements I and II are true.
I, II, III, and IV: The vertex must lie on the axis of symmetry, , so cannot be the vertex.
Archived released STAAR Algebra II EOC · 2013 · Item 33 · 1 point
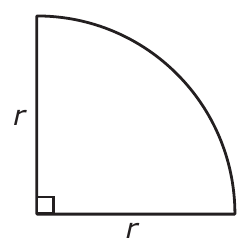
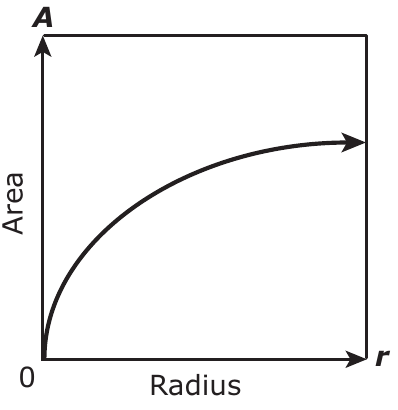
A sector of a circle is shown. The area, , of the sector is times the square of the radius, . Which graph represents this relationship?
- Graph A
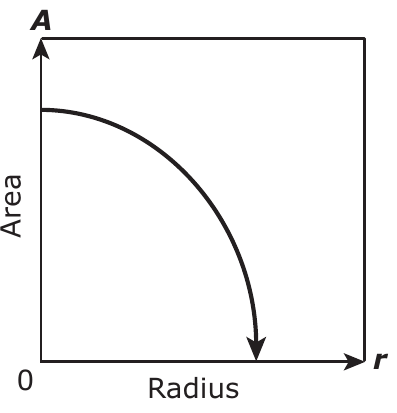
- Graph B
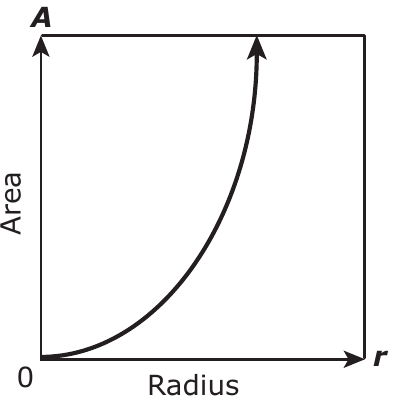
- Graph C
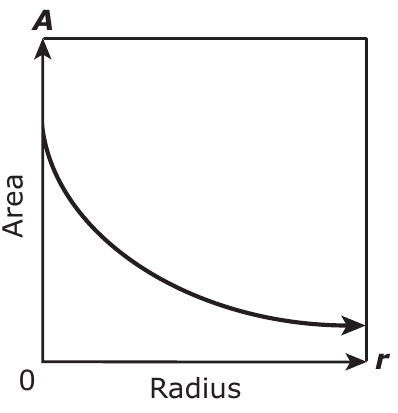
- Graph D
Show STAAR answer and explanation
Graph B
is a quadratic function of r with a positive coefficient. It starts at the origin, increases, and rises more steeply as r increases—the upward-curving Graph B.
Graph A: Graph A decreases to zero as the radius grows, but a larger radius gives a larger area.
Graph C: Graph C starts above zero and decreases; a sector with radius 0 has area 0.
Graph D: Graph D increases but levels off, like a square root. grows faster and faster.
Learning objectives
By the end of the lesson, students can:
- Write vertex form from a vertex and another point.
- Use equal table outputs to locate an axis of symmetry.
- Match a quadratic model to its graph and contextual behavior.
Instructional sequence
- 1
Engage
5 minCompare a graph that grows more steeply with one that rises but levels off.
- 2
Direct instruction
12 minModel finding a from a known vertex and another point.
- 3
Table investigation
13 minFind matching outputs, calculate midpoint inputs, and infer reflected intercepts.
- 4
Representation sort
13 minMatch area contexts, tables, equations, and graphs using at least two features.
- 5
Closure
7 minStudents explain one match and complete the exit ticket.
Misconceptions to address
Teacher move: A table may omit the vertex. Locate the symmetry axis before identifying the vertex.
Teacher move: A positive quadratic becomes steeper to the right of its vertex; a square-root curve typically levels off.