

Solutions from Quadratic Graphs
Use graphs to determine and interpret solution sets of quadratic equations.
Students connect the zeros of a quadratic graph to the solution set of , explain why a quadratic can have two, one, or no real solutions, and verify graphical answers algebraically.
Lesson plan and worked examples by TEKSForge · not a TEA-issued lesson. Videos by independent educators.
Archived course: TEKS code and readiness label from TEA's 2013 Algebra II key. Algebra II is not one of Texas's current required STAAR EOC assessments, and this lesson does not change the Biology and Algebra I Study Plans.
Learn the concept
Zeros are solutions
To solve , find the inputs that make the output 0. On a graph, those points lie on the x-axis. If a parabola crosses the axis at and , the solution set is .
Two, one, or none
A parabola can cross the x-axis twice, touch it once at the vertex, or never reach it. These cases correspond to two real solutions, one repeated real solution, and no real solutions.
Verify the graph
Graphs show approximate locations. Confirm values by substitution or by matching factors: zeros at −2 and 4 correspond to factors and .
Study released STAAR visuals
Use the original graphs, tables, and diagrams from released STAAR questions to practice reading labels, values, and relationships before answering the items below.
Archived released STAAR Algebra II EOC · 2013 · Item 4 · 1 point
Worked example
The graph of crosses the x-axis at two grid points. Find and verify the solution set of .
- The graph meets the x-axis at (−2, 0) and (4, 0).
- Factor the rule: .
- Each factor is zero at or , matching the graph.
Watch the lesson
Texas public-school, Texas educator-created, and TEKS-aligned lessons, hosted by their creators. Each card names its source.
Algebra 2 Interpreting Quadratic Graphs
UT IPSI · Kid2Kid / Texas Education AgencyRead and interpret key points on quadratic graphs, including where the graph meets the x-axis.
Watch on YouTubeAlgebra 2 Solving Quadratic Equations
UT IPSI · Kid2Kid / Texas Education AgencySolve quadratic equations and connect the algebraic solutions to their graphs.
Watch on YouTubeTry it yourself
TEKSForge practice · unscored
1. A parabola opens upward and has vertex (3, 0). How many real solutions does f(x) = 0 have?
Show answer and reasoning
One real solution, x = 3
The vertex lies on the x-axis and is the lowest point, so the graph touches the axis only once.
2. A parabola opens upward and has vertex (1, 5). How many real solutions does f(x) = 0 have?
Show answer and reasoning
No real solutions
The lowest output is 5, so the graph never reaches y = 0.
Released STAAR practice
Texas Education Agency · archived 2013 released EOC items · scored with TEA's answer key; step-by-step explanations written by TEKSForge because this release has no rationales. Original graphs, tables, and diagrams are shown where the released item includes one.
Archived released STAAR Algebra II EOC · 2013 · Item 4 · 1 point
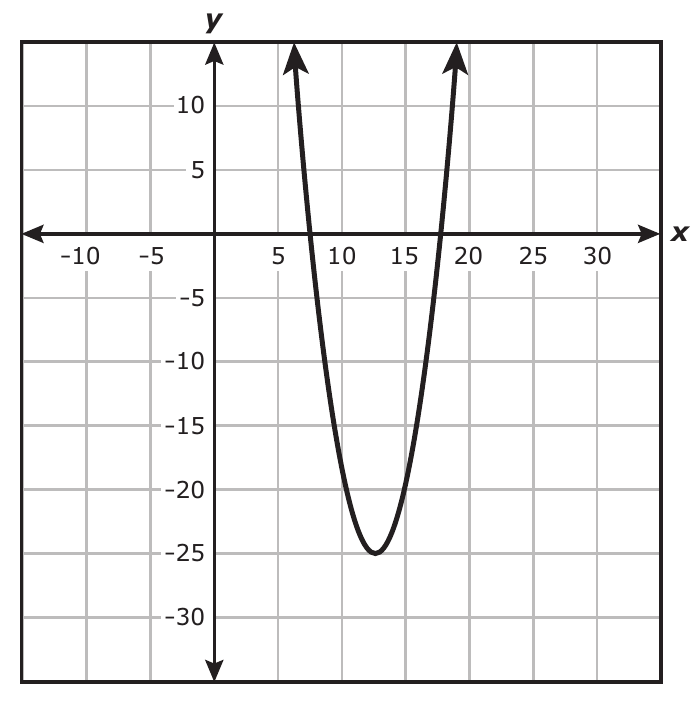
The graph of the quadratic function is shown on the grid. What does the solution set for appear to be?
Show STAAR answer and explanation
The solutions to are the x-coordinates where the graph crosses the x-axis. The parabola crosses at approximately 7.5 and 17.5.
: 12.5 is the x-coordinate of the vertex, where is about −25 rather than 0.
: These are the vertex coordinates, not the two x-intercepts.
: The graph has only two x-intercepts; 12.5 locates the axis of symmetry, not another zero.
Learning objectives
By the end of the lesson, students can:
- Identify the solutions of as the x-intercepts of the graph.
- Explain how the vertex position determines the number of real solutions.
- Verify graphical solutions by substitution or factoring.
Instructional sequence
- 1
Engage
5 minShow three parabolas that cross, touch, and miss the x-axis. Ask what each says about the equation f(x) = 0.
- 2
Direct instruction
10 minConnect y = 0 to the x-axis. Model reading intercepts precisely from grid lines.
- 3
Guided practice
12 minRead zeros from graphs, write the solution sets, and verify each solution by substitution.
- 4
Compare methods
12 minMatch graphs to factored forms and explain why the graph and algebra give the same values.
- 5
Closure
6 minStudents complete the exit ticket and name one graph with no real solutions.
Misconceptions to address
Teacher move: The y-intercept is where x = 0. Solutions to f(x) = 0 are the x-values where the output y is 0.
Teacher move: Show a parabola touching the x-axis at its vertex (one real solution) and one that does not reach the axis (no real solutions).