

Graphing Linear Functions
Graph linear functions and identify key features: x-intercept, y-intercept, zero, and slope.
Students connect slope-intercept form, tables, and graphs while interpreting slope, intercepts, and zeros in mathematical and real-world contexts.
Lesson plan and worked examples by TEKSForge · not a TEA-issued lesson. Videos by independent educators.
Learn the concept
Graph from an equation
In , b is the y-value when x is zero and m is the constant rate of change. Plot , use rise over run to locate another point, and draw the line through both points.
Intercepts and zeros
The y-intercept occurs at x=0. The x-intercept occurs at y=0; its x-coordinate is the function's zero. For with nonzero m, the zero is .
Interpret units
Slope is output units per input unit. An intercept can represent a starting amount or a break-even point, but only when the context's domain includes that value. Label axes and distinguish an ordered-pair intercept from a single zero.
Visualize the concept
Original TEKSForge instructional diagrams, designed for this TEKS skill and clearly distinguished from released STAAR artwork.

Study released STAAR visuals
Use the original graphs, tables, and diagrams from released STAAR questions to practice reading labels, values, and relationships before answering the items below.
Released STAAR Algebra I EOC · 2019 · Item 26 · 1 point
Released STAAR Algebra I EOC · 2019 · Item 35 · 1 point
Released STAAR Algebra I EOC · 2019 · Item 7 · 1 point
Released STAAR Algebra I EOC · 2022 · Item 32 · 1 point
Released STAAR Algebra I EOC · 2022 · Item 54 · 1 point
Released STAAR Algebra I EOC · 2021 · Item 9 · 1 point
Released STAAR Algebra I EOC · 2021 · Item 41 · 1 point
Released STAAR Algebra I EOC · 2021 · Item 51 · 1 point
Released STAAR Algebra I EOC · 2025 · Item 19 · 1 point
Released STAAR Algebra I EOC · 2026 · Item 49 · 1 point
Worked example
Graph and identify its intercepts.
- Plot the y-intercept .
- Use slope −2: move right 1 and down 2 to ; repeat to .
- Set y=0: , so x=3 and the x-intercept is .
Slope −2; y-intercept ; x-intercept ; zero 3.
Watch the lesson
Texas public-school, Texas educator-created, and TEKS-aligned lessons, hosted by their creators. Each card names its source.
Algebra 1 Graphing Functions
Five Minute Math · Aaron Daffern, Dallas ISDGraph linear functions and identify intercepts, zeros, and slope.
Watch on YouTubeTry it yourself
TEKSForge practice · unscored
1. Find both intercepts of .
Show answer and reasoning
and
Use x=0 to get y=−9; use y=0 to solve 3x−9=0 and get x=3.
2. What does the slope mean in , with cost in dollars and time in hours?
Show answer and reasoning
Cost increases by $12 per additional hour.
The coefficient of h is the rate in dollars per hour. The 25 is the initial cost, not the hourly rate.
Released STAAR practice
Texas Education Agency · released EOC items · explanations adapted from TEA rationales. Original graphs, tables, and diagrams are shown where the released item includes one.
Released STAAR Algebra I EOC · 2019 · Item 26 · 1 point
The graph of linear function passes through the point and has a slope of . What is the zero of ?
- 2
- 4
- −6
- −2
Show STAAR answer and explanation
−2
Find b: , so and . Set : , so .
2: The sign is wrong. Solve carefully: .
4: Check how you used the slope. Going from up to with slope −3 moves left, not right.
−6: −6 is the y-intercept. The zero is the x-value where .
Released STAAR Algebra I EOC · 2019 · Item 35 · 1 point
The graph of linear function passes through the points and . Which statement must be true?
- The slope of the graph of is .
- The graph of passes through the point .
- The zero of is 7.
- The x-intercept of the graph of is −7.
Show STAAR answer and explanation
The x-intercept of the graph of is −7.
The point has a y-value of 0, so the graph crosses the x-axis at −7. That is the x-intercept.
The slope of the graph of is .: A sign error was made. The slope is .
The graph of passes through the point .: This flips the signs of . That point isn't on the line.
The zero of is 7.: The zero is where , at , not 7.
Released STAAR Algebra I EOC · 2019 · Item 7 · 1 point
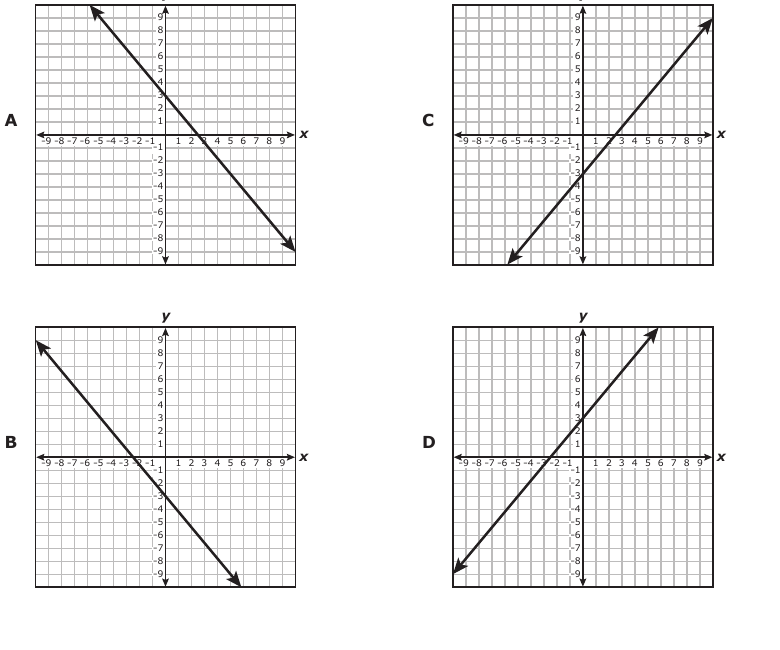
Which graph best represents ?
- Graph A
- Graph B
- Graph C
- Graph D
Show STAAR answer and explanation
Graph C
Divide by −5: . Graph C has slope and y-intercept −3.
Graph A: This line has a negative slope, but the simplified equation has slope .
Graph B: This line has a negative slope instead of .
Graph D: This line has y-intercept 3 rather than −3.
Released STAAR Algebra I EOC · 2022 · Item 32 · 1 point
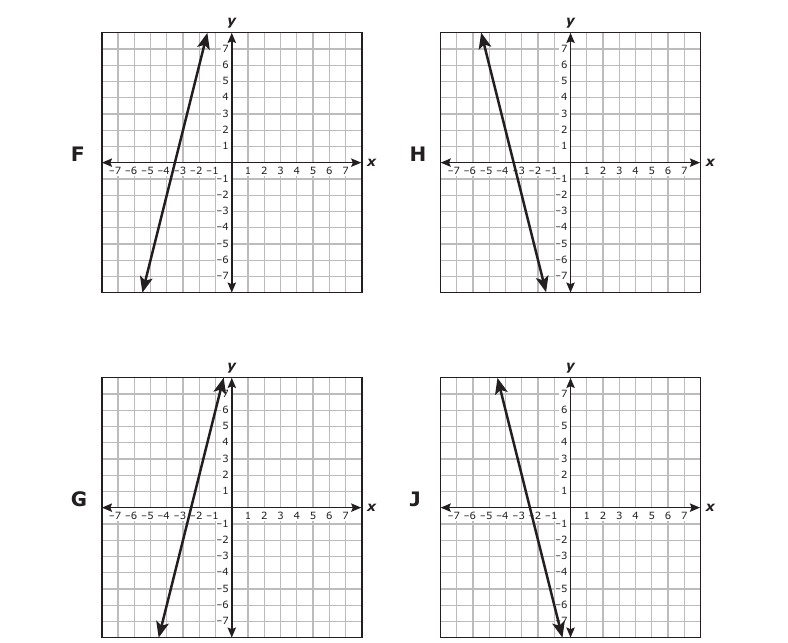
Which graph best represents ?
- Graph F
- Graph G
- Graph H
- Graph J
Show STAAR answer and explanation
Graph H
The slope is −4 and the line passes through . Graph H has that negative slope and contains .
Graph F: This line rises from left to right, but the slope is −4.
Graph G: This line has a positive slope; the given slope is −4.
Graph J: This negative-slope line does not pass through .
Released STAAR Algebra I EOC · 2022 · Item 54 · 1 point
Linear function has a zero of −2 and a y-intercept of 6. Which graph best represents ?
- Graph F
- Graph G
- Graph H
- Graph J
Show STAAR answer and explanation
Graph G
The line must pass through and . Its slope is , matching Graph G.
Graph F: This line has a negative slope and does not pass through .
Graph H: This line has a positive slope but the wrong intercepts.
Graph J: This line has a negative slope; the required slope is 3.
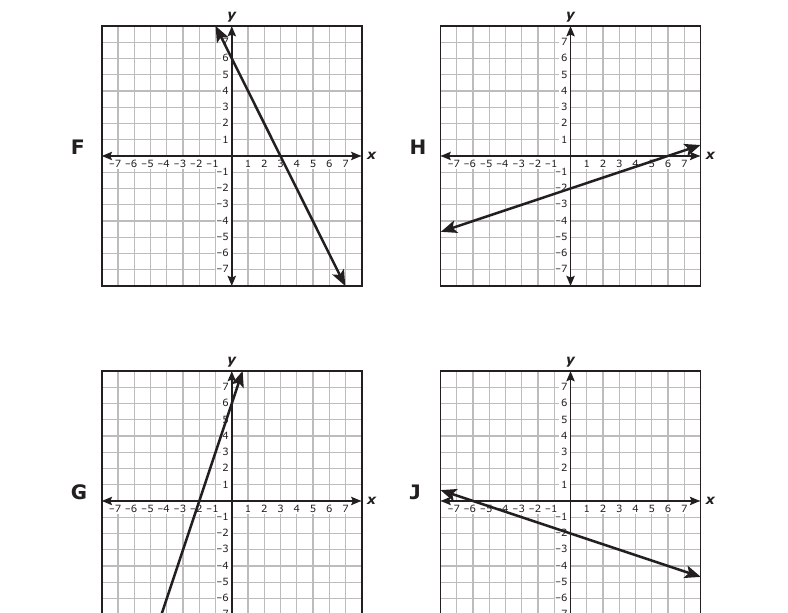
Released STAAR Algebra I EOC · 2021 · Item 9 · 1 point
The graph of linear function passes through the points and , as shown. What are the slope and y-intercept of the graph of ?
- The slope is , and the y-intercept is −1.
- The slope is , and the y-intercept is 1.
- The slope is , and the y-intercept is −1.
- The slope is , and the y-intercept is 1.
Show STAAR answer and explanation
The slope is , and the y-intercept is 1.
Slope: . Using gives , so .
The slope is , and the y-intercept is −1.: The slope is correct, but the graph crosses the y-axis at 1.
The slope is , and the y-intercept is −1.: The slope uses rise over run, not run over rise, and the y-intercept is 1.
The slope is , and the y-intercept is 1.: The y-intercept is correct, but the slope is .
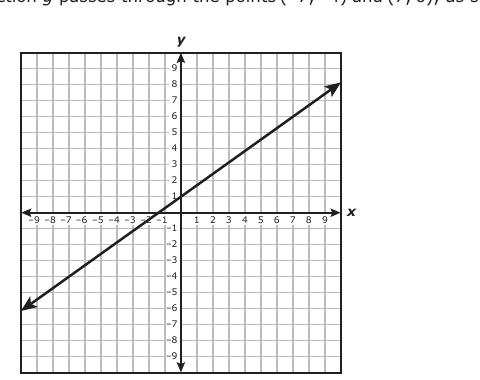
Released STAAR Algebra I EOC · 2021 · Item 41 · 1 point
Linear function has an x-intercept of −1 and a y-intercept of 5. Which graph best represents ?
- Graph A
- Graph B
- Graph C
- Graph D
Show STAAR answer and explanation
Graph D
The graph must contain and . The slope is , matching Graph D.
Graph A: This line has a small positive slope and does not pass through .
Graph B: This line has a negative slope; the required slope is 5.
Graph C: This line has a negative slope instead of 5.
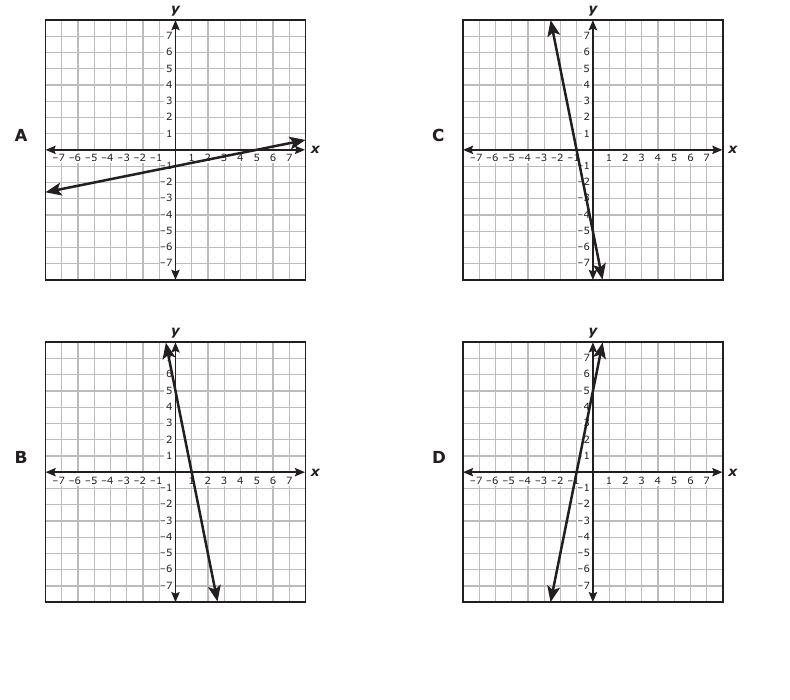
Released STAAR Algebra I EOC · 2021 · Item 51 · 1 point
The graph models the linear relationship between the number of monthly payments made on a loan and the remaining balance in dollars left to pay on the loan. Which statement describes the x-intercept of the graph?
- The x-intercept is 60, which represents the initial balance in dollars of the loan.
- The x-intercept is 27,000, which represents the initial balance in dollars of the loan.
- The x-intercept is 60, which represents the number of monthly payments needed to repay the loan.
- The x-intercept is 27,000, which represents the number of monthly payments needed to repay the loan.
Show STAAR answer and explanation
The x-intercept is 60, which represents the number of monthly payments needed to repay the loan.
The x-intercept is where the remaining balance is 0. The line reaches at , so 60 monthly payments repay the loan.
The x-intercept is 60, which represents the initial balance in dollars of the loan.: 60 is a number of payments, not a dollar balance; the initial balance is the y-intercept.
The x-intercept is 27,000, which represents the initial balance in dollars of the loan.: 27,000 is the initial dollar balance and y-intercept, not the x-intercept.
The x-intercept is 27,000, which represents the number of monthly payments needed to repay the loan.: The x-axis measures payments and reaches zero balance at 60, not 27,000.
Released STAAR Algebra I EOC · 2026 · Item 9 · 1 point
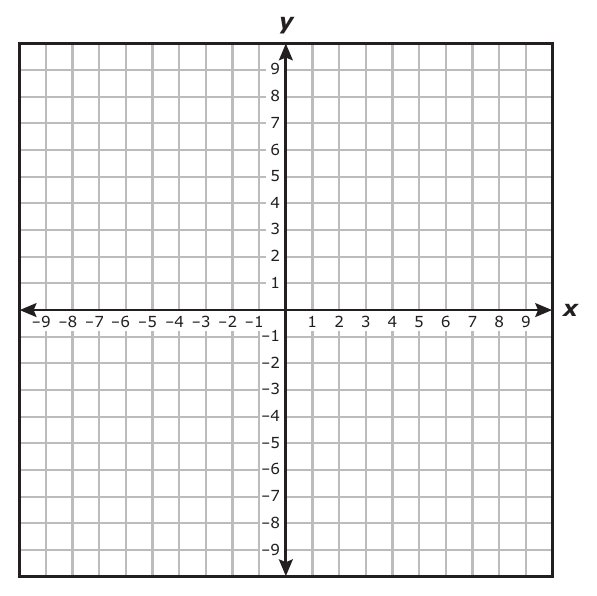
Graph the line represented by the equation .
Show STAAR answer and explanation
A line through and
The -intercept is 2, so graph . The slope is , so moving 3 units right and 2 units down gives .
Released STAAR Algebra I EOC · 2024 · Item 22 · 1 point
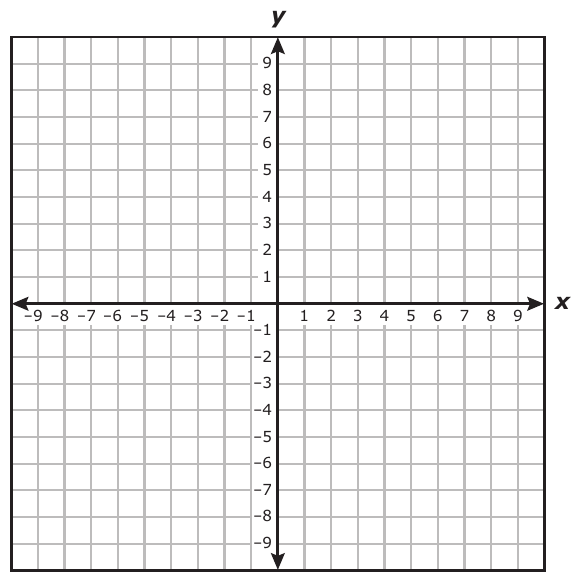
Graph the line represented by the equation .
Show STAAR answer and explanation
A line through and
Setting x = 0 gives y = 2, and setting y = 0 gives x = 3. Plot and and connect them. Equivalently, the line is .
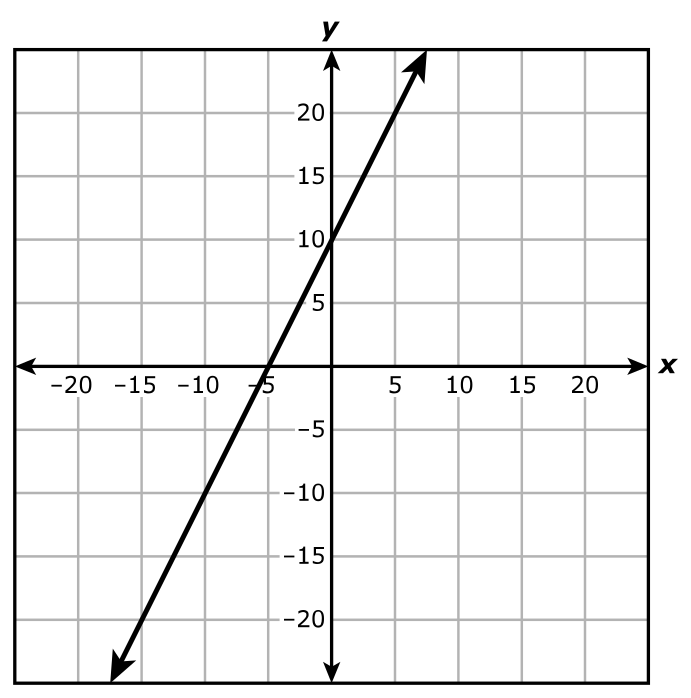
Released STAAR Algebra I EOC · 2025 · Item 19 · 1 point
A graph of a linear function is shown. Which value best represents the zero of the function?
- 2
- 10
- –5
- –2
Show STAAR answer and explanation
–5
The zero is the -value where . The line crosses the -axis at , so the zero is −5.
2: This is the slope of the line, not the zero.
10: This is the -intercept, where the line crosses the -axis.
–2: This is the opposite of the slope, not the zero.
Released STAAR Algebra I EOC · 2025 · Item 35 · 1 point
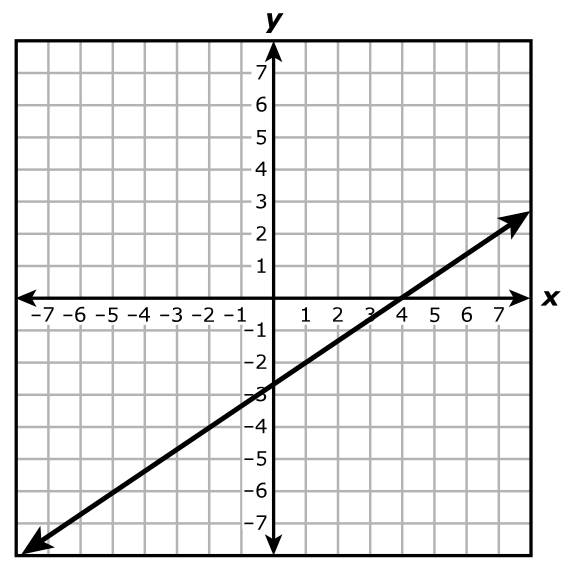
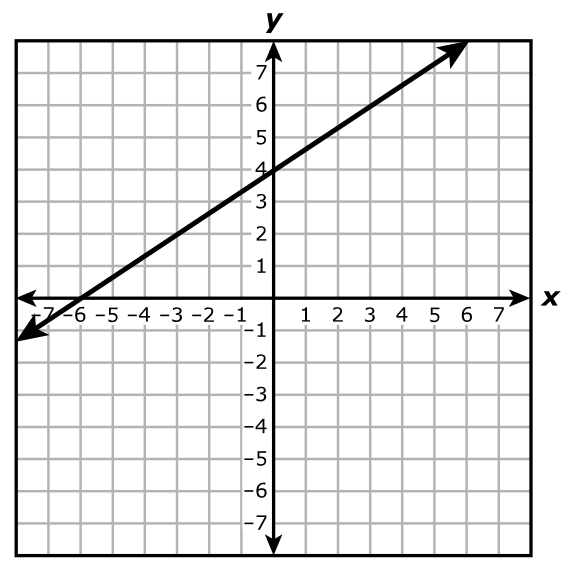
Which graph best represents a line that has a slope of and a -intercept of 4?
- Graph A
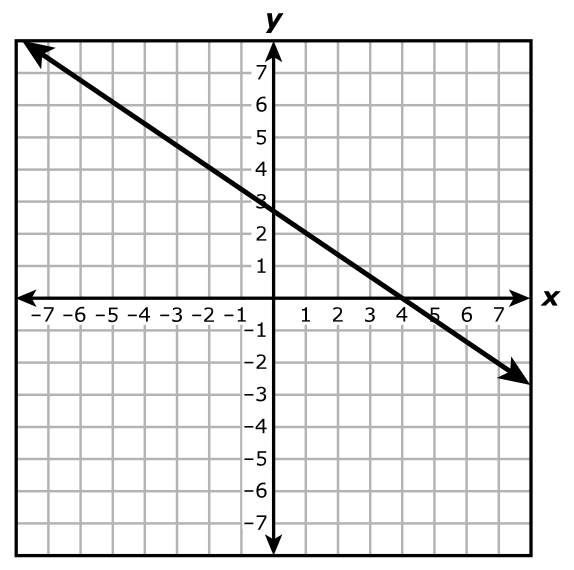
- Graph B
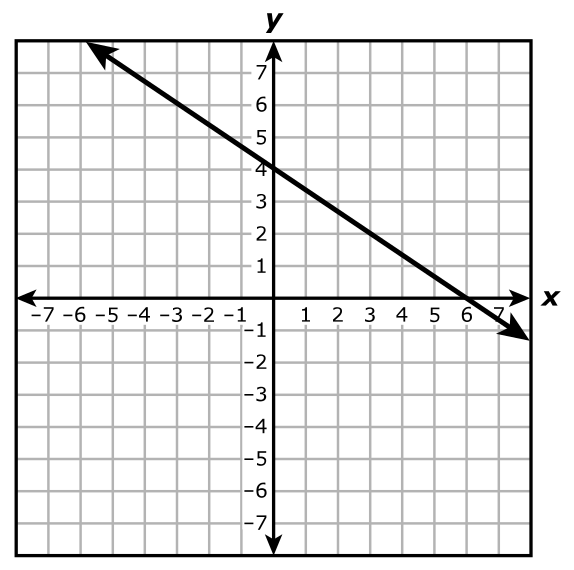
- Graph C
- Graph D
Show STAAR answer and explanation
Graph D
The line crosses the -axis at . A slope of means moving 3 units right and 2 units up, so is also on the line. Graph D shows this line.
Graph A: This line passes through , treating the -intercept as an -intercept, and it slopes down.
Graph B: This line passes through , but it moves 2 units down instead of up for every 3 units right.
Graph C: This line treats the -intercept as the -intercept .
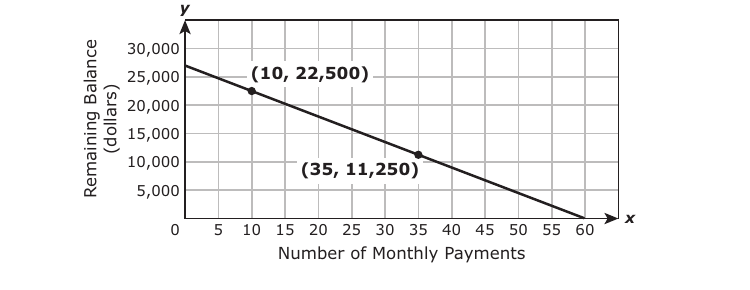
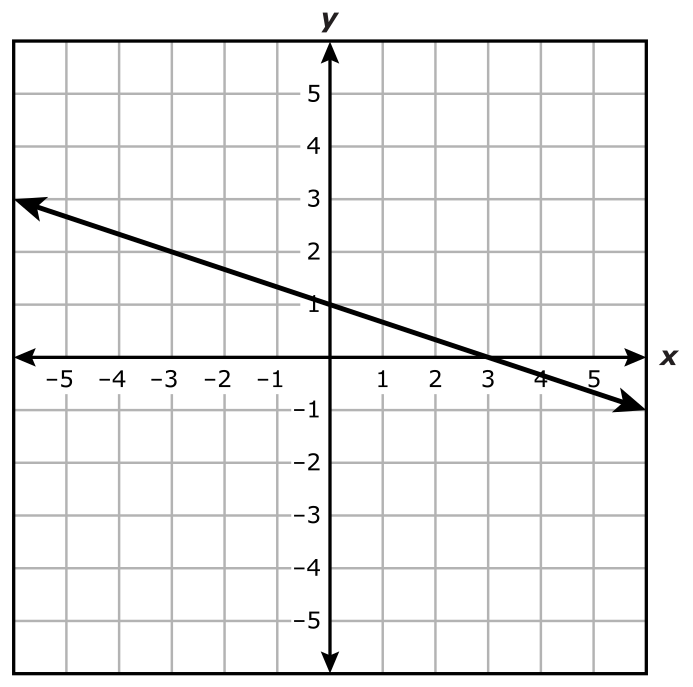
Released STAAR Algebra I EOC · 2026 · Item 49 · 1 point
The graph of a linear function is shown on the grid. Which value best represents the -intercept of the function?
- –1
- –3
- 1
- 3
Show STAAR answer and explanation
1
The line crosses the -axis at , so the -intercept is 1.
3: This is the -intercept, where the line crosses the -axis.
–1: This uses the wrong sign for the point .
–3: This treats the -intercept as the -intercept and uses the wrong sign.
Learning objectives
By the end of the lesson, students can:
- Graph a linear function using slope and the y-intercept.
- Calculate and distinguish the x-intercept, y-intercept, and zero.
- Interpret slope and intercepts using the units of a context.
Instructional sequence
- 1
Engage
5 minCompare two profit graphs and ask which changes faster and where each breaks even.
- 2
Direct instruction
12 minStart at , use rise over run to place a second point, and draw the line. Define slope as a rate of change.
- 3
Guided practice
13 minFind the y-intercept with and the x-intercept with . Connect the x-intercept to the function's zero.
- 4
Context application
13 minFor , interpret 45 dollars per hour, the starting value, and the break-even point.
- 5
Closure
7 minStudents graph a final equation and label slope, both intercepts, and the zero.
Misconceptions to address
Teacher move: Set each input condition explicitly: y-intercept uses x=0; a zero uses y=0.
Teacher move: Attach units and meaning: output change per one unit of input.