

Released STAAR Algebra I EOC · 2026 · Item 49 · 1 point
Walkthrough: Algebra I 2026, Item 49
A.3C · Graphing Linear Functions · unscored study
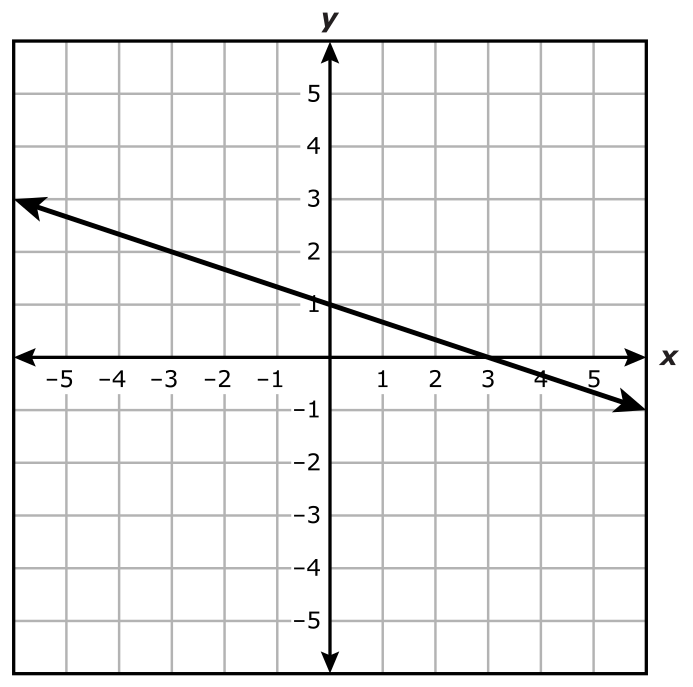
The graph of a linear function is shown on the grid. Which value best represents the -intercept of the function?
- –1
- –3
- 1
- 3
1. Understand the question
The -intercept is where the line crosses the vertical -axis.
Try the question on your own first, then reveal one step at a time.
2. Solve it step by step
Question, artwork, answer key and rationale: Texas Education Agency released STAAR test. Walkthrough steps written by TEKSForge. Studying here does not change your mastery or scores.