

Graphing Quadratics
Graph quadratic functions and identify the vertex, axis of symmetry, and zeros.
Students use vertex form and symmetry to graph quadratic functions and identify the vertex, axis of symmetry, direction, and zeros.
Lesson plan and worked examples by TEKSForge · not a TEA-issued lesson. Videos by independent educators.
Learn the concept
Vertex form
For , the vertex is and the axis of symmetry is x=h. Positive a opens upward and gives a minimum; negative a opens downward and gives a maximum. The inside expression equals zero at x=h, explaining the apparent sign reversal.
Use symmetry
Plot the vertex first. Inputs equally far from the axis have equal outputs. Calculate points on either side rather than guessing the curve's width. The y-intercept comes from x=0, and zeros come from y=0.
Other forms
For , the axis is . Substitute that input to get the vertex's y-coordinate. If two real zeros are known, their midpoint is the axis of symmetry.
Visualize the concept
Original TEKSForge instructional diagrams, designed for this TEKS skill and clearly distinguished from released STAAR artwork.

Study released STAAR visuals
Use the original graphs, tables, and diagrams from released STAAR questions to practice reading labels, values, and relationships before answering the items below.
Released STAAR Algebra I EOC · 2022 · Item 1 · 1 point
Released STAAR Algebra I EOC · 2019 · Item 46 · 1 point
Released STAAR Algebra I EOC · 2019 · Item 21 · 1 point
Released STAAR Algebra I EOC · 2022 · Item 40 · 1 point
Released STAAR Algebra I EOC · 2021 · Item 7 · 1 point
Released STAAR Algebra I EOC · 2021 · Item 34 · 1 point
Released STAAR Algebra I EOC · 2025 · Item 15 · 1 point
Released STAAR Algebra I EOC · 2023 · Item 49 · 2 points
Released STAAR Algebra I EOC · 2024 · Item 25 · 2 points
Released STAAR Algebra I EOC · 2025 · Item 21 · 1 point
Released STAAR Algebra I EOC · 2026 · Item 28 · 1 point
Worked example
Find the vertex and zeros of .
- Read h=2 and k=−9: vertex and axis x=2.
- Set y=0 to obtain .
- Take both square roots: , so x=−1 or x=5.
- The zeros' midpoint is 2, agreeing with the axis.
Vertex ; zeros −1 and 5; opens upward.
Watch the lesson
Texas public-school, Texas educator-created, and TEKS-aligned lessons, hosted by their creators. Each card names its source.
Algebra 1 Min/Max Values of Quadratic Function Graphs
Five Minute Math · Aaron Daffern, Dallas ISDUse a parabola to identify its vertex, opening, maximum or minimum, and other key attributes.
Watch on YouTubeTry it yourself
TEKSForge practice · unscored
1. Identify the vertex and opening of .
Show answer and reasoning
Vertex ; opens downward.
Write x+1 as x−(−1), so h=−1. The negative leading coefficient makes the vertex a maximum.
2. A quadratic has zeros −4 and 6. What is its axis of symmetry?
Show answer and reasoning
x=1
The axis lies halfway between the zeros: (−4+6)/2=1.
Released STAAR practice
Texas Education Agency · released EOC items · explanations adapted from TEA rationales. Original graphs, tables, and diagrams are shown where the released item includes one.
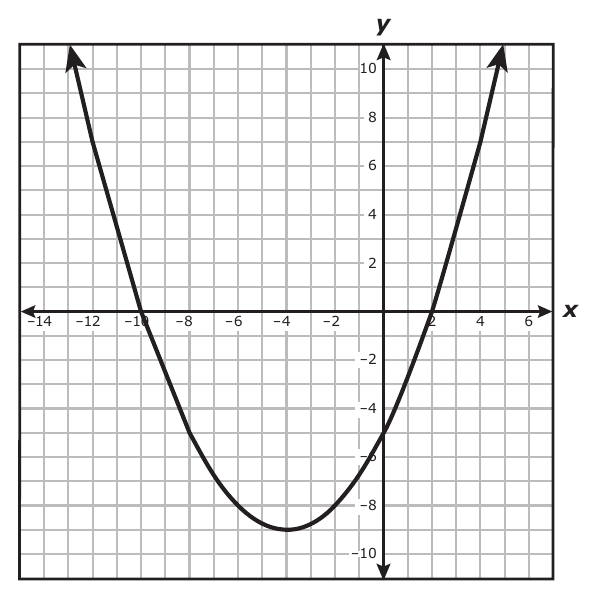
Released STAAR Algebra I EOC · 2022 · Item 1 · 1 point
The graph of quadratic function is shown on the grid. Which answer choice best represents the intercepts of the graph of ?
- x-intercept: (5, 0); y-intercepts: (0, 10) and (0, −2)
- x-intercepts: (0, −10) and (0, 2); y-intercept: (−5, 0)
- x-intercept: (0, 5); y-intercepts: (10, 0) and (−2, 0)
- x-intercepts: (−10, 0) and (2, 0); y-intercept: (0, −5)
Show STAAR answer and explanation
x-intercepts: (−10, 0) and (2, 0); y-intercept: (0, −5)
x-intercepts have a y-coordinate of 0: and . The y-intercept has an x-coordinate of 0: .
x-intercept: (5, 0); y-intercepts: (0, 10) and (0, −2): The x- and y-intercepts were switched and their signs reversed.
x-intercepts: (0, −10) and (0, 2); y-intercept: (−5, 0): The coordinates in each ordered pair were switched. x-intercepts look like .
x-intercept: (0, 5); y-intercepts: (10, 0) and (−2, 0): The intercepts were switched and the signs reversed.
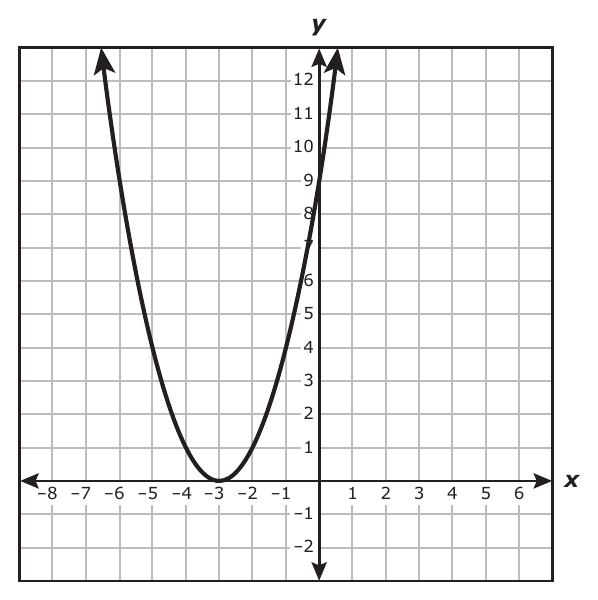
Released STAAR Algebra I EOC · 2019 · Item 46 · 1 point
The graph of quadratic function is shown on the grid. Which statements are best supported by the graph of ? I. The x-intercept is located at . II. The coordinates of the y-intercept are . III. The axis of symmetry is .
- I and II only
- I and III only
- II and III only
- I, II, and III
Show STAAR answer and explanation
I, II, and III
The graph touches the x-axis only at , crosses the y-axis at , and is symmetric about the vertical line . All three statements are true.
I and II only: The axis of symmetry passes through the vertex at , so III is also true.
I and III only: The graph crosses the y-axis at , so II is also true.
II and III only: The vertex sits on the x-axis, so it is the x-intercept. I is also true.
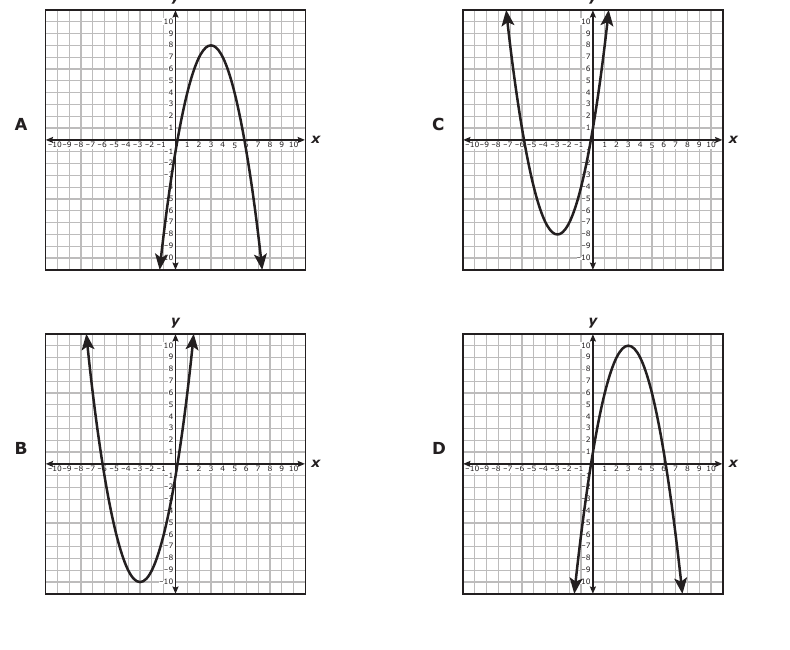
Released STAAR Algebra I EOC · 2019 · Item 21 · 1 point
Which graph best represents ?
- Graph A
- Graph B
- Graph C
- Graph D
Show STAAR answer and explanation
Graph A
The coefficient of is negative, so the parabola opens down. Its axis is , and , giving vertex and y-intercept −1.
Graph B: This parabola opens upward; the coefficient of is −1.
Graph C: This parabola opens upward rather than downward.
Graph D: Check the y-intercept and zeros against and the vertex .
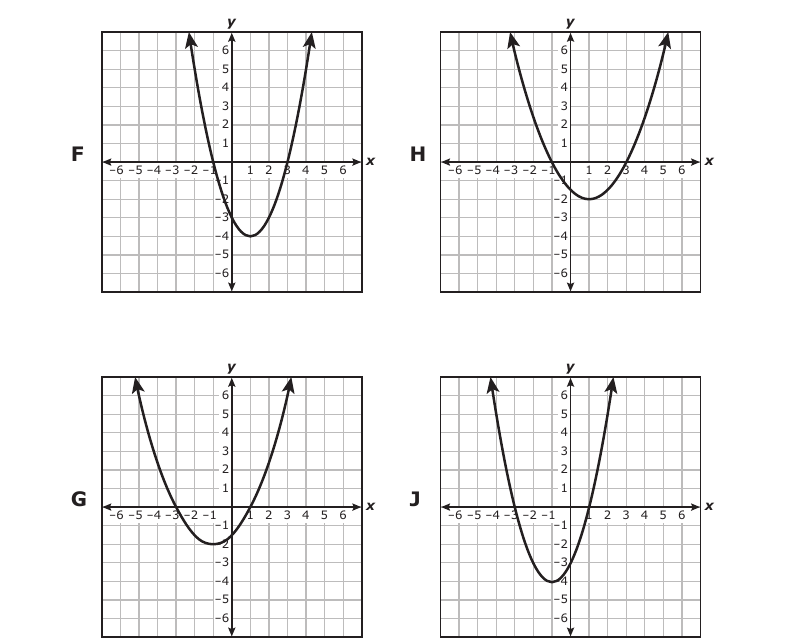
Released STAAR Algebra I EOC · 2022 · Item 40 · 1 point
Which graph best represents ?
- Graph F
- Graph G
- Graph H
- Graph J
Show STAAR answer and explanation
Graph F
The zeros are and . Expanding gives , so the graph opens upward and has y-intercept −3.
Graph G: This graph does not have both x-intercepts −1 and 3.
Graph H: The vertex and y-intercept do not match .
Graph J: Check the zeros: gives −1 and gives 3.
Released STAAR Algebra I EOC · 2021 · Item 7 · 1 point
Two characteristics of quadratic function are given. • The axis of symmetry of the graph of is . • Function has exactly one zero. Based on this information, which graph could represent ?
- Graph A
- Graph B
- Graph C
- Graph D
Show STAAR answer and explanation
Graph A
Exactly one zero means the vertex lies on the x-axis. The axis places that vertex at , as shown in Graph A.
Graph B: This graph has two x-intercepts, not exactly one zero.
Graph C: The vertex is not on the x-axis, so the function has no real zero.
Graph D: This graph has two zeros rather than one.
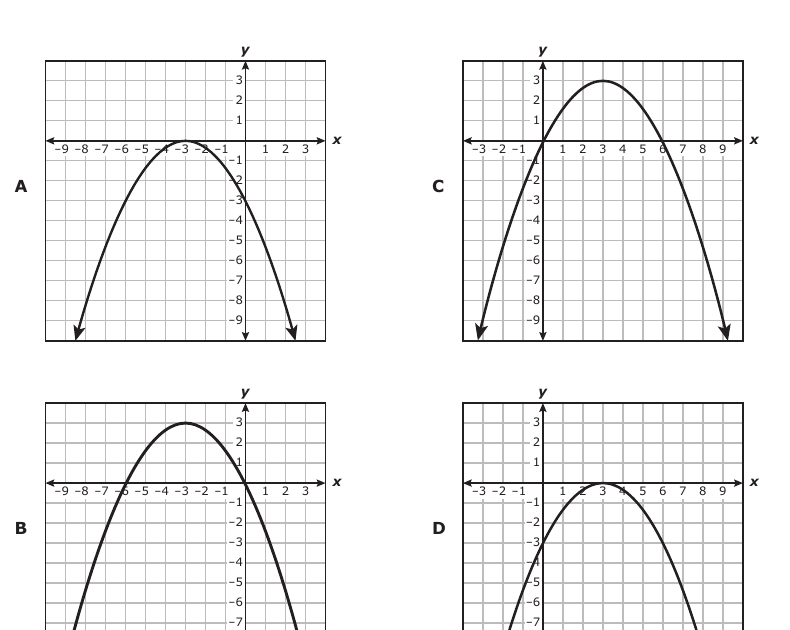
Released STAAR Algebra I EOC · 2021 · Item 34 · 1 point
Quadratic function can be used to model the height in feet of a rocket from the ground seconds after it was launched. The graph of the function is shown. What is the maximum value of the graph of the function?
Show STAAR answer and explanation
225
The maximum value is the y-coordinate of the vertex. The vertex is halfway between and , at , where the height is 225 feet.
144: 144 is the height at and , not the maximum.
7.5: 7.5 is the time when the rocket returns to the ground, not a height.
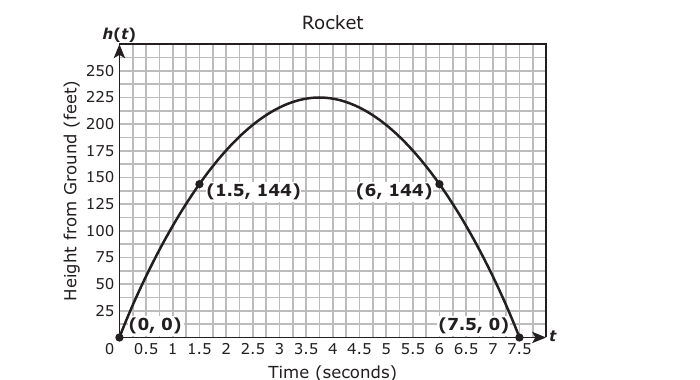
Released STAAR Algebra I EOC · 2025 · Item 15 · 1 point
A graph of a quadratic function is shown. Which location best represents the -intercept of the function?
Show STAAR answer and explanation
The point at
The -intercept is the point where the graph crosses the -axis. This graph crosses the -axis at .
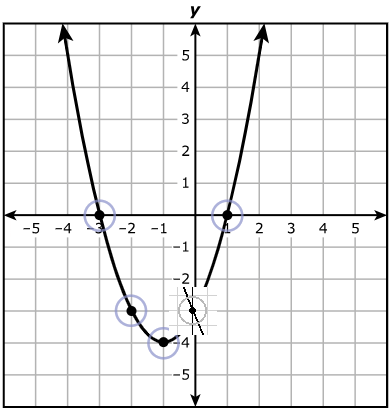
Released STAAR Algebra I EOC · 2023 · Item 49 · 2 points
The graph of a quadratic function is shown. Which values best represent the zeros of the function?
Show STAAR answer and explanation
and
Zeros are the x-values where the function has a y-value of zero. The released graph crosses the x-axis at and .
: This is the x-coordinate of the vertex, not an x-intercept.
: This is the minimum y-value, not a zero of the function.
: At x = 0 the curve is below the x-axis, so its y-value is not zero.
: This is the y-intercept's value, not an x-intercept.
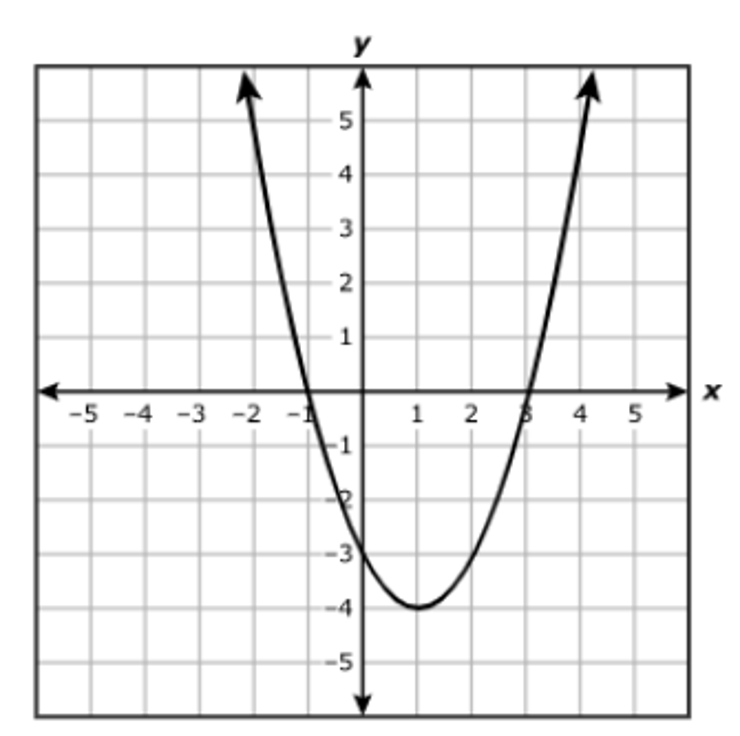
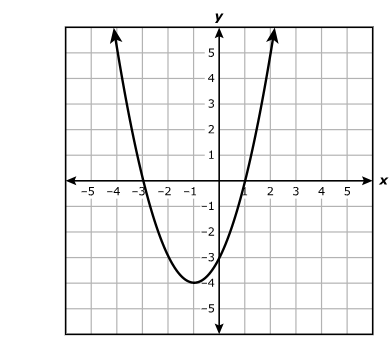
Released STAAR Algebra I EOC · 2024 · Item 25 · 2 points
A graph of a quadratic function is shown on the grid. Complete the statement about the quadratic function. Move the correct answer to each box. Not all answers will be used.
Show STAAR answer and explanation
The function has a minimum value of −4.
The graph opens upward and its vertex is , so the function has a minimum value of .
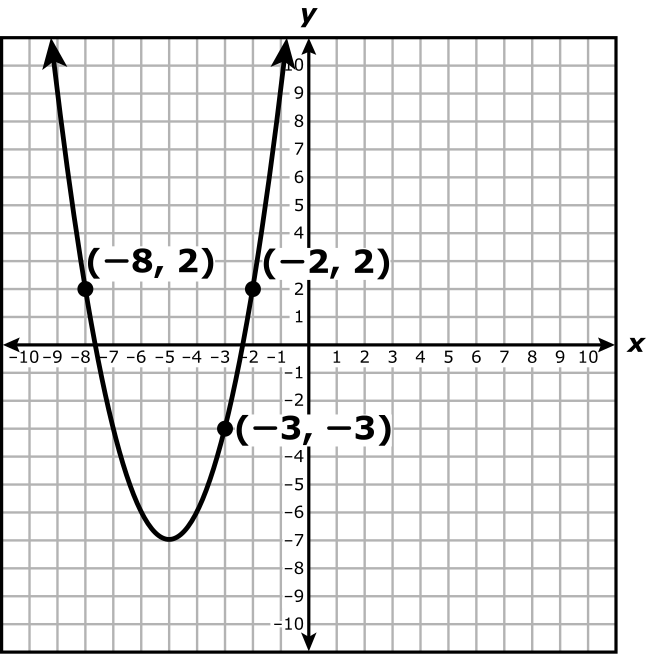
Released STAAR Algebra I EOC · 2025 · Item 21 · 1 point
The graph of quadratic function is shown on the grid. Which equation represents the axis of symmetry of the graph of ?
Show STAAR answer and explanation
The vertex of the graph is . The axis of symmetry is the vertical line through the vertex, so it is .
: The labeled point has equal coordinates, but it is not the vertex.
: This uses the vertex's -coordinate. The axis of symmetry is a vertical line, .
: The labeled points and share a -coordinate, but the axis of symmetry is the vertical line halfway between them.
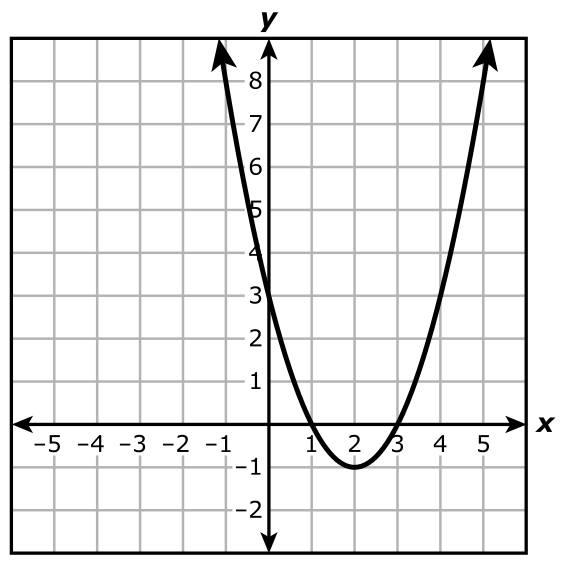
Released STAAR Algebra I EOC · 2026 · Item 2 · 1 point
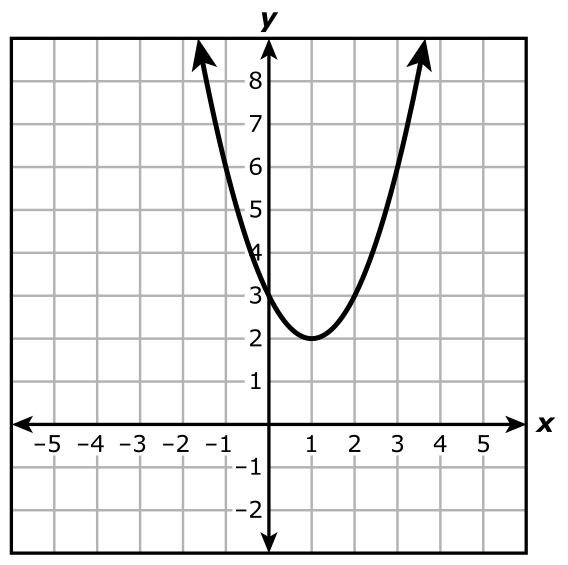
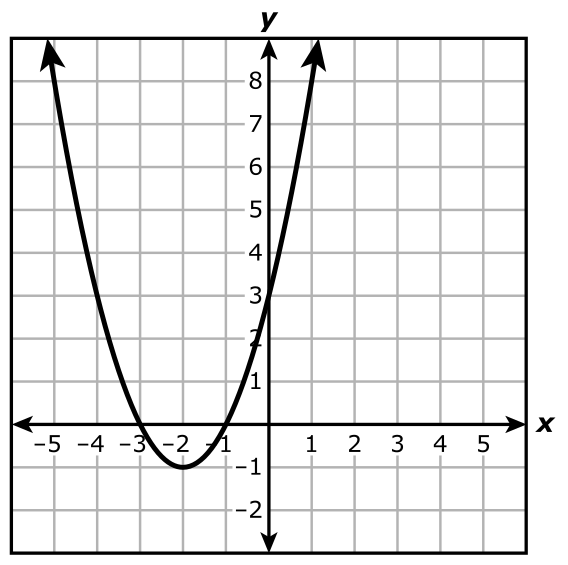
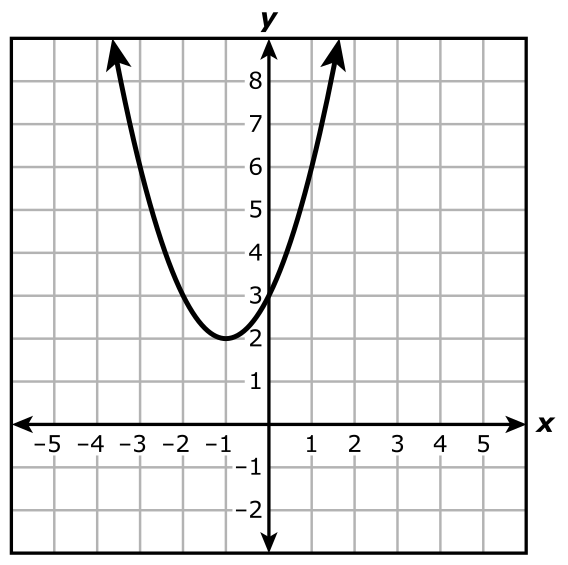
Which graph best represents the quadratic function ?
- Graph A
- Graph B
- Graph C
- Graph D
Show STAAR answer and explanation
Graph A
The vertex's -coordinate is , and . Graph A is the parabola with vertex .
Graph B: This parabola has vertex : was evaluated as 1, and the vertex coordinates were reversed.
Graph C: This parabola has vertex ; the sign of the vertex's -coordinate is wrong.
Graph D: This parabola has vertex ; the vertex's coordinates were reversed.
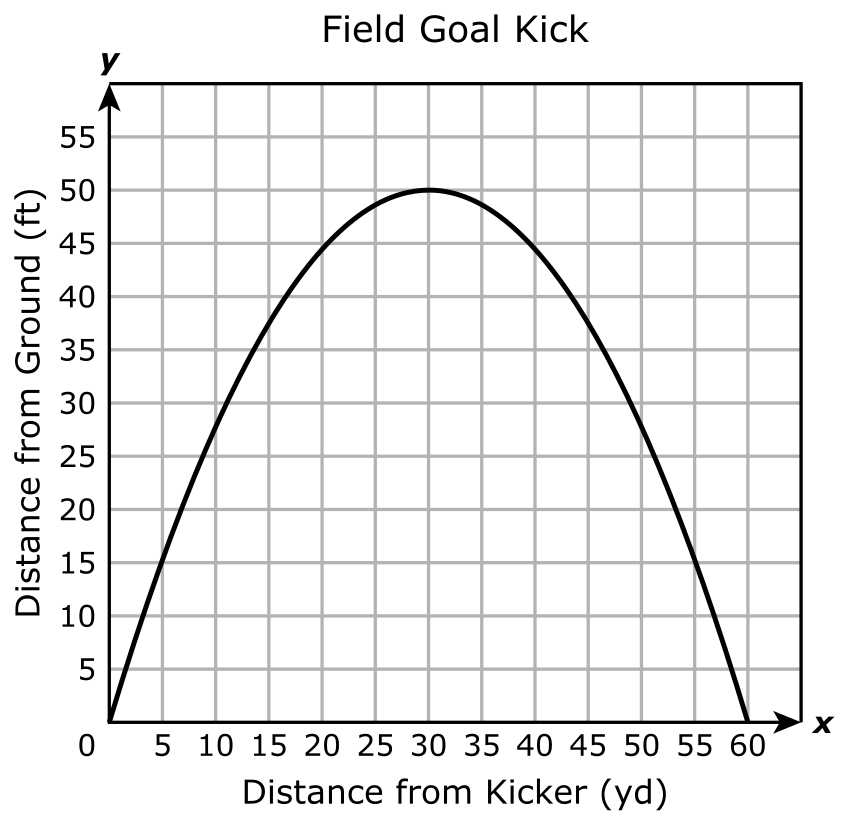
Released STAAR Algebra I EOC · 2026 · Item 28 · 1 point
The graph of a quadratic function shown models the distance of a football from the ground in feet after it was kicked, , as it relates to the horizontal distance of the football from the kicker in yards, . What is the equation of the axis of symmetry of the graph?
Show STAAR answer and explanation
The vertex of the graph is . The axis of symmetry is the vertical line through the vertex, .
: This uses the vertex's -coordinate. The axis of symmetry is a vertical line.
: This vertical line passes through the zero at , not the vertex.
: The axis of symmetry is a vertical line halfway between the zeros, not a horizontal line.
Learning objectives
By the end of the lesson, students can:
- Identify , , and and graph a quadratic in vertex form.
- Use the vertex and axis of symmetry to describe key features.
- Find zeros from a graph or equation and connect them to symmetry.
Instructional sequence
- 1
Engage
5 minDisplay and collect predictions about why the vertex moves right rather than left.
- 2
Direct instruction
12 minConnect to opening and stretch, to the vertex, and to the axis. Solve the inside expression for zero to explain the sign of h.
- 3
Guided graphing
13 minPlot the vertex, use symmetric points on both sides, and verify direction and width against a parent function.
- 4
Feature application
13 minUse and the midpoint of zeros. Interpret the vertex of a projectile model as a maximum.
- 5
Closure
7 minComplete a key-feature summary for one new quadratic.
Misconceptions to address
Teacher move: Set ; the vertex's x-coordinate is h, so gives h=3.
Teacher move: Use the order and let the sign of a determine minimum or maximum.