

Released STAAR Algebra I EOC · 2026 · Item 28 · 1 point
Walkthrough: Algebra I 2026, Item 28
A.7A · Graphing Quadratics · unscored study
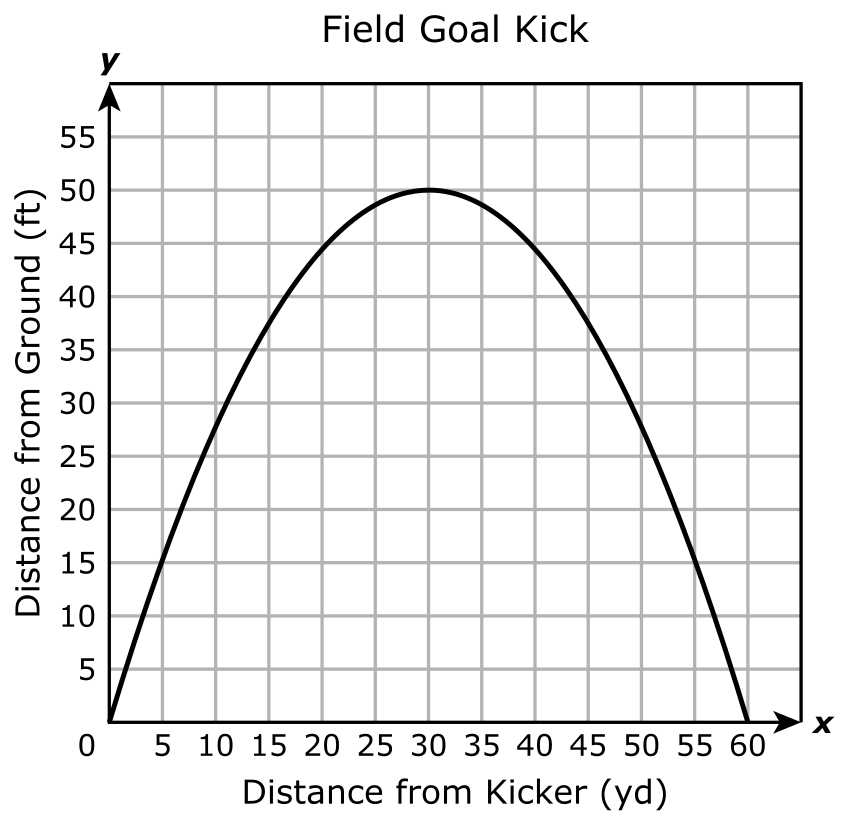
The graph of a quadratic function shown models the distance of a football from the ground in feet after it was kicked, , as it relates to the horizontal distance of the football from the kicker in yards, . What is the equation of the axis of symmetry of the graph?
1. Understand the question
The axis of symmetry is the vertical line through the vertex, the highest point of the kick.
Try the question on your own first, then reveal one step at a time.
2. Solve it step by step
Question, artwork, answer key and rationale: Texas Education Agency released STAAR test. Walkthrough steps written by TEKSForge. Studying here does not change your mastery or scores.