

Released STAAR Biology EOC · 2026 · Item 7 · 1 point
Walkthrough: Biology 2026, Item 7
B.11B · Enzymes · unscored study
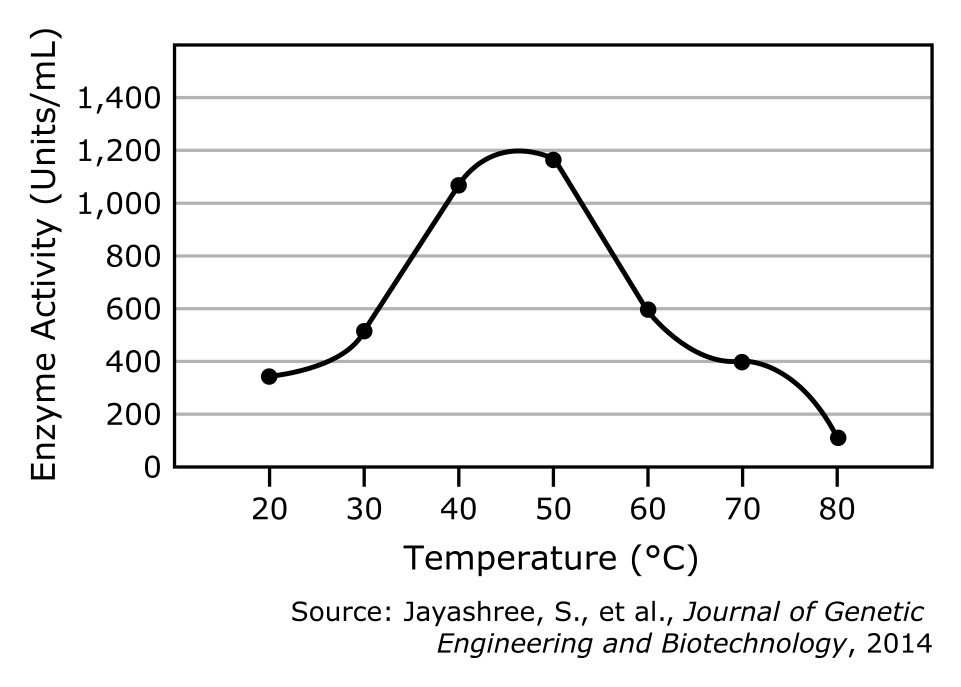
A graph of enzyme activity is shown. Which statement is BEST supported by the data?
- The enzyme is denatured and can no longer bind to its substrate between 20 and 40 °C.
- The enzyme is able to optimally function and bind to its substrate at around 45 °C.
- The enzyme can only bind to its substrate at temperatures between 30 and 60 °C.
- The enzyme can no longer bind to its substrate at temperatures greater than 60 °C.
1. Understand the question
Read the enzyme-activity graph. The highest point on the curve is the enzyme's optimal temperature.
Try the question on your own first, then reveal one step at a time.
2. Solve it step by step
Question, artwork, answer key and rationale: Texas Education Agency released STAAR test. Walkthrough steps written by TEKSForge. Studying here does not change your mastery or scores.